
Concept explainers
Videos
Formulas with rational expressions are often used to model learning. Many of these formulas model the proportion of correct responses in terms of the number of trials of a particular task. One such model, called a learning curve, is
where P is the proportion of correct responses after x trials. If
, there are no correct responses. If
, all responses are correct. The graph of the rational formula is shown. Use the formula to solve Exercises 103-104.
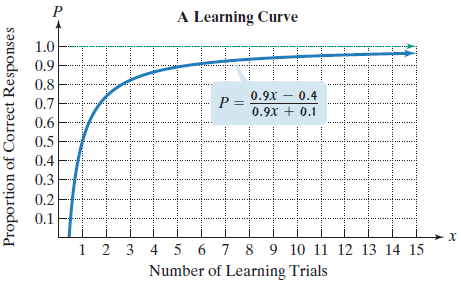
How many learning trials are necessary for 0.95 of the responses to be correct? Identify your solution as a point on the graph.
Want to see the full answer?
Check out a sample textbook solution
Chapter 1 Solutions
Pearson eText Algebra & Trigonometry -- Instant Access (Pearson+)


- Jamal wants to save $48,000 for a down payment on a home. How much will he need to invest in an account with 11.8% APR, compounding daily, in order to reach his goal in 10 years? Round to the nearest dollar.arrow_forwardr nt Use the compound interest formula, A (t) = P(1 + 1)". An account is opened with an intial deposit of $7,500 and earns 3.8% interest compounded semi- annually. Round all answers to the nearest dollar. a. What will the account be worth in 10 years? $ b. What if the interest were compounding monthly? $ c. What if the interest were compounded daily (assume 365 days in a year)? $arrow_forwardKyoko has $10,000 that she wants to invest. Her bank has several accounts to choose from. Her goal is to have $15,000 by the time she finishes graduate school in 7 years. To the nearest hundredth of a percent, what should her minimum annual interest rate be in order to reach her goal assuming they compound daily? (Hint: solve the compound interest formula for the intrerest rate. Also, assume there are 365 days in a year) %arrow_forward
- 3:56 wust.instructure.com Page 0 Chapter 5 Test Form A of 2 - ZOOM + | Find any real numbers for which each expression is undefined. 2x 4 1. x Name: Date: 1. 3.x-5 2. 2. x²+x-12 4x-24 3. Evaluate when x=-3. 3. x Simplify each rational expression. x²-3x 4. 2x-6 5. x²+3x-18 x²-9 6. Write an equivalent rational expression with the given denominator. 2x-3 x²+2x+1(x+1)(x+2) Perform the indicated operation and simplify if possible. x²-16 x-3 7. 3x-9 x²+2x-8 x²+9x+20 5x+25 8. 4.x 2x² 9. x-5 x-5 3 5 10. 4x-3 8x-6 2 3 11. x-4 x+4 x 12. x-2x-8 x²-4 ← -> Copyright ©2020 Pearson Education, Inc. + 5 4. 5. 6. 7. 8. 9. 10. 11. 12. T-97arrow_forwardProblem #5 Suppose you flip a two sided fair coin ("heads" or "tails") 8 total times. a). How many ways result in 6 tails and 2 heads? b). How many ways result in 2 tails and 6 heads? c). Compare your answers to part (a) and (b) and explain in a few sentences why the comparison makes sense.arrow_forwardA local company has a 6 person management team and 20 employees. The company needs to select 3 people from the management team and 7 employees to attend a regional meeting. How many different possibilities are there for the group that can be sent to the regional meeting?arrow_forward
- I have 15 outfits to select from to pack for my business trip. I would like to select three of them to pack in my suitcase. How many packing possibilities are there?arrow_forwardThere are 15 candidates running for any of 5 distinct positions on the local school board. In how many different ways could the 5 positions be filled?arrow_forwardCelina is picking a new frame for a custom piece of artwork. She has to select a frame size, material, and color. There are four different frame sizes, three different frame materials, and six different frame colors. She must chose one option only from each category. How many different possible frames could Celina pick from?arrow_forward
- A research study in the year 2009 found that there were 2760 coyotes in a given region. The coyote population declined at a rate of 5.8% each year. How many fewer coyotes were there in 2024 than in 2015? Explain in at least one sentence how you solved the problem. Show your work. Round your answer to the nearest whole number.arrow_forwardAnswer the following questions related to the following matrix A = 3 ³).arrow_forwardExplain the following termsarrow_forward
 Glencoe Algebra 1, Student Edition, 9780079039897...AlgebraISBN:9780079039897Author:CarterPublisher:McGraw Hill
 Trigonometry (MindTap Course List)TrigonometryISBN:9781337278461Author:Ron LarsonPublisher:Cengage Learning
 Algebra & Trigonometry with Analytic GeometryAlgebraISBN:9781133382119Author:SwokowskiPublisher:Cengage
 Elementary AlgebraAlgebraISBN:9780998625713Author:Lynn Marecek, MaryAnne Anthony-SmithPublisher:OpenStax - Rice University
 College Algebra (MindTap Course List)AlgebraISBN:9781305652231Author:R. David Gustafson, Jeff HughesPublisher:Cengage Learning