Videos
In graph theory, an adjacency matrix, A, is a way of representing which nodes (or vertices) are connected. For a simple directed graph, each entry, , is either 1 (if a direct path exists from node i to node j) or 0 (if no direct path exists from node i to node j). For example, consider the following graph and corresponding adjacency matrix. 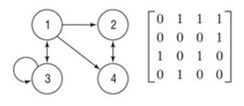 The entry is 1 because a direct path exists from node 1 to node 4. However, the entry is 0 because no path exists from node 4 to node 1. The entry is 1 because a direct path exists from node 3 to itself. The matrix indicates the number of ways to get from node i to node j within k moves (steps).
Website Map A content map can be used to show how different pages on a website are connected. For example, the following content map shows the relationship among the five pages of a certain website with links between pages represented by arrows.  The content map can be represented by a 5 by 5 adjacency matrix where each entry,
, is either 1 (if a link exists from page i to page j) or 0 (if no link exists from page i to page j).
The content map can be represented by a 5 by 5 adjacency matrix where each entry,
, is either 1 (if a link exists from page i to page j) or 0 (if no link exists from page i to page j).
(a) Write the 5 by 5 adjacency matrix that represents the given content map.
(b) Explain the significance of the entries on the main diagonal in your result from part (a).
(c) Find and interpret .
Want to see the full answer?
Check out a sample textbook solution
Chapter 11 Solutions
Precalculus (10th Edition)


- Explain the conditions under Radius of Convergence which of Power Series is 0arrow_forwardExplain the key points and reasons for 12.8.2 (1) and 12.8.2 (2)arrow_forwardQ1: A slider in a machine moves along a fixed straight rod. Its distance x cm along the rod is given below for various values of the time. Find the velocity and acceleration of the slider when t = 0.3 seconds. t(seconds) x(cm) 0 0.1 0.2 0.3 0.4 0.5 0.6 30.13 31.62 32.87 33.64 33.95 33.81 33.24 Q2: Using the Runge-Kutta method of fourth order, solve for y atr = 1.2, From dy_2xy +et = dx x²+xc* Take h=0.2. given x = 1, y = 0 Q3:Approximate the solution of the following equation using finite difference method. ly -(1-y= y = x), y(1) = 2 and y(3) = −1 On the interval (1≤x≤3).(taking h=0.5).arrow_forward
- Consider the function f(x) = x²-1. (a) Find the instantaneous rate of change of f(x) at x=1 using the definition of the derivative. Show all your steps clearly. (b) Sketch the graph of f(x) around x = 1. Draw the secant line passing through the points on the graph where x 1 and x-> 1+h (for a small positive value of h, illustrate conceptually). Then, draw the tangent line to the graph at x=1. Explain how the slope of the tangent line relates to the value you found in part (a). (c) In a few sentences, explain what the instantaneous rate of change of f(x) at x = 1 represents in the context of the graph of f(x). How does the rate of change of this function vary at different points?arrow_forward1. The graph of ƒ is given. Use the graph to evaluate each of the following values. If a value does not exist, state that fact. и (a) f'(-5) (b) f'(-3) (c) f'(0) (d) f'(5) 2. Find an equation of the tangent line to the graph of y = g(x) at x = 5 if g(5) = −3 and g'(5) = 4. - 3. If an equation of the tangent line to the graph of y = f(x) at the point where x 2 is y = 4x — 5, find ƒ(2) and f'(2).arrow_forwardDoes the series converge or divergearrow_forward
- Suppose that a particle moves along a straight line with velocity v (t) = 62t, where 0 < t <3 (v(t) in meters per second, t in seconds). Find the displacement d (t) at time t and the displacement up to t = 3. d(t) ds = ["v (s) da = { The displacement up to t = 3 is d(3)- meters.arrow_forwardLet f (x) = x², a 3, and b = = 4. Answer exactly. a. Find the average value fave of f between a and b. fave b. Find a point c where f (c) = fave. Enter only one of the possible values for c. c=arrow_forwardplease do Q3arrow_forward
 Linear Algebra: A Modern IntroductionAlgebraISBN:9781285463247Author:David PoolePublisher:Cengage Learning