Concept explainers
(a)
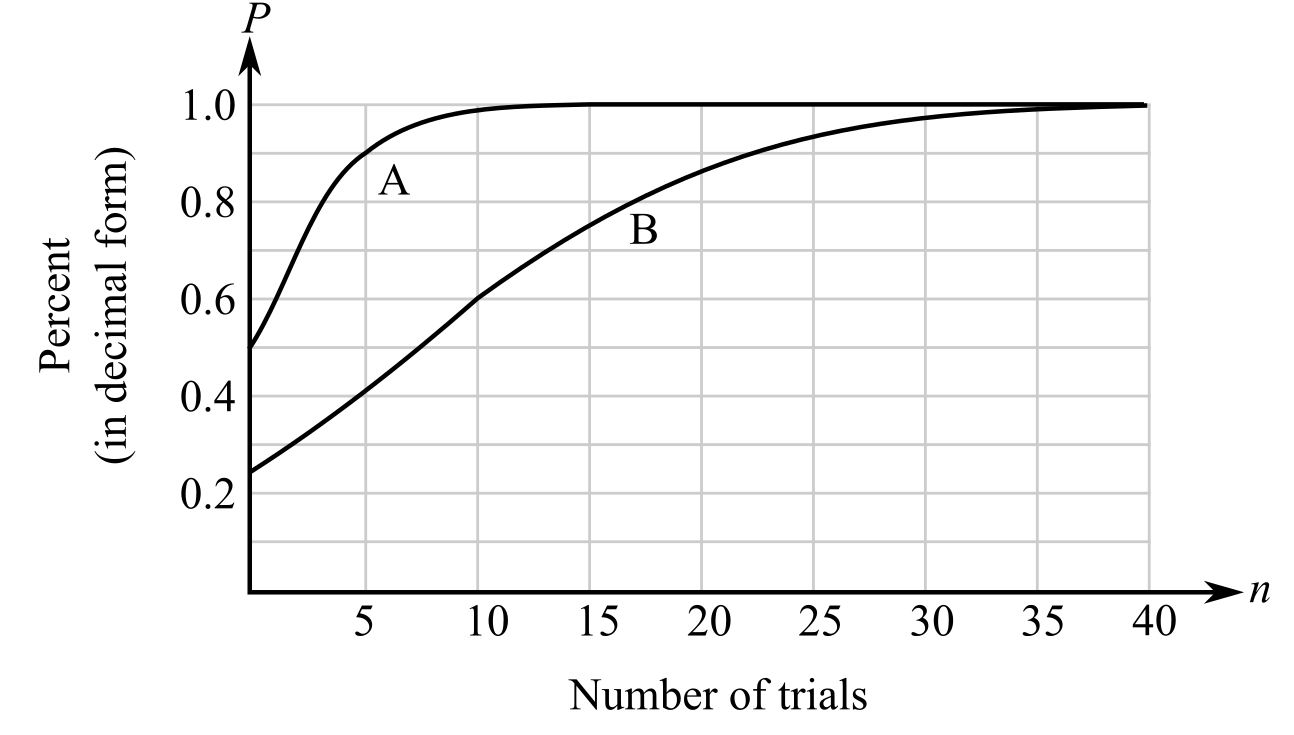
The percent of the correct responses prior to any trials for each group if in a learning theory project, the rate of change in the percent P of correct responses after n trials can be modeled by,
The graph showing the particular solutions for the two different groups is as follows:

(b)
The limit of P for each group as n approaches infinity if in a learning theory project, the rate of change in the percent P of correct responses after n trials can be modeled by,
The graph showing the particular solutions for the two different groups is as follows:

(c)
The number of trials for
The graph showing the particular solutions for the two different groups is as follows:

Trending nowThis is a popular solution!

Chapter 11 Solutions
EBK CALCULUS: AN APPLIED APPROACH
- Vectors u = 6(cos 60°i + sin60°j), v = 4(cos 315°i + sin315°j), and w = −12(cos 330°i + sin330°j) are given. Use exact values when evaluating sine and cosine.Part A: Convert the vectors to component form and find −7(u • v). Show every step of your work.Part B: Convert the vectors to component form and use the dot product to determine if u and w are parallel, orthogonal, or neither. Justify your answer.arrow_forwardSuppose that one factory inputs its goods from two different plants, A and B, with different costs, 3 and 7 each respective. And suppose the price function in the market is decided as p(x, y) = 100 - x - y where x and y are the demand functions and 0 < x, y. Then as x = y= the factory can attain the maximum profit,arrow_forwardf(x) = = x - 3 x²-9 f(x) = {x + 1 x > 3 4 x < 3 -10 5 10 5 5. 10 5- 07. 10 -10 -5 0 10 5 -101 :: The function has a “step" or "jump" discontinuity at x = 3 where f(3) = 7. :: The function has a value of f (3), a limit as x approaches 3, but is not continuous at x = 3. :: The function has a limit as x approaches 3, but the function is not defined and is not continuous at x = 3. :: The function has a removable discontinuity at x=3 and an infinite discontinuity at x= -3.arrow_forward
- Calculus lll May I please have the solutions for the following examples? Thank youarrow_forwardCalculus lll May I please have the solutions for the following exercises that are blank? Thank youarrow_forwardThe graph of 2(x² + y²)² = 25 (x²-y²), shown in the figure, is a lemniscate of Bernoulli. Find the equation of the tangent line at the point (3,1). -10 Write the expression for the slope in terms of x and y. slope = 4x³ + 4xy2-25x 2 3 4x²y + 4y³ + 25y Write the equation for the line tangent to the point (3,1). LV Q +arrow_forward
- Find the equation of the tangent line at the given value of x on the curve. 2y3+xy-y= 250x4; x=1 y=arrow_forwardFind the equation of the tangent line at the given point on the curve. 3y² -√x=44, (16,4) y=] ...arrow_forwardFor a certain product, cost C and revenue R are given as follows, where x is the number of units sold in hundreds. Cost: C² = x² +92√x+56 Revenue: 898(x-6)² + 24R² = 16,224 dC a. Find the marginal cost at x = 6. dx The marginal cost is estimated to be $ ☐ . (Do not round until the final answer. Then round to the nearest hundredth as needed.)arrow_forward
- The graph of 3 (x² + y²)² = 100 (x² - y²), shown in the figure, is a lemniscate of Bernoulli. Find the equation of the tangent line at the point (4,2). АУ -10 10 Write the expression for the slope in terms of x and y. slope =arrow_forwardUse a geometric series to represent each of the given functions as a power series about x=0, and find their intervals of convergence. a. f(x)=5/(3-x) b. g(x)= 3/(x-2)arrow_forwardAn object of mass 4 kg is given an initial downward velocity of 60 m/sec and then allowed to fall under the influence of gravity. Assume that the force in newtons due to air resistance is - 8v, where v is the velocity of the object in m/sec. Determine the equation of motion of the object. If the object is initially 500 m above the ground, determine when the object will strike the ground. Assume that the acceleration due to gravity is 9.81 m/sec² and let x(t) represent the distance the object has fallen in t seconds. Determine the equation of motion of the object. x(t) = (Use integers or decimals for any numbers in the expression. Round to two decimal places as needed.)arrow_forward
 College AlgebraAlgebraISBN:9781305115545Author:James Stewart, Lothar Redlin, Saleem WatsonPublisher:Cengage Learning
 Algebra and Trigonometry (MindTap Course List)AlgebraISBN:9781305071742Author:James Stewart, Lothar Redlin, Saleem WatsonPublisher:Cengage Learning
 Functions and Change: A Modeling Approach to Coll...AlgebraISBN:9781337111348Author:Bruce Crauder, Benny Evans, Alan NoellPublisher:Cengage Learning
 Glencoe Algebra 1, Student Edition, 9780079039897...AlgebraISBN:9780079039897Author:CarterPublisher:McGraw HillAlgebra & Trigonometry with Analytic GeometryAlgebraISBN:9781133382119Author:SwokowskiPublisher:Cengage


