
Videos
(i)
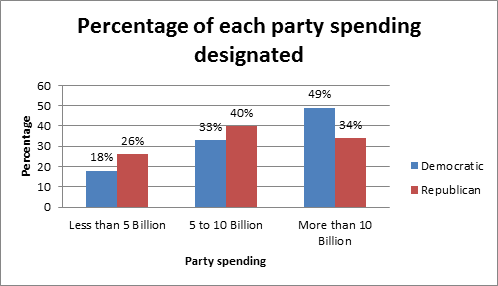
To graph: A cluster bar graph showing the percentages of Congress members from each party who spent each designated amount in their respective home districts.
(i)
Explanation of Solution
Calculation: To find the percentage table:
| Party | Less than 5 Billion | 5 to 10 Billion | More than 10 Billion |
| Democratic | |||
| Republican |
Graph: To create cluster bar graph by using Excel is as follows:
Step 1: Enter the percentage data table in Excel worksheet.
Step 2: Select table and go to Insert > Charts > Column.
The cluster bar graph is obtained as:
(ii)
(a)
The level of significance and state the null and alternative hypotheses.
(ii)
(a)
Answer to Problem 18P
Solution: The level of significance is 0.01.
Explanation of Solution
The level of significance,
The null hypothesis for testing is defined as,
The alternative hypothesis is defined as,
(b)
To test: Whether all the expected frequencies are greater than 5. Also determine the value of chi-square statistic for the sample, the sampling distribution that should be used and degrees of freedom for the test.
(b)
Answer to Problem 18P
Solution: The value of chi-square statistic for the sample,
Explanation of Solution
Calculation: The find the
Step 1: Go to Stat >Tables> Chi-square Test For Association.
Step 2: Select ‘Summarized data in two-way table’ and select <5B, 5-10B, >10Bin ‘Columns containing the table’ box.
Step 3: Select ‘Partyin ‘Rows’ and write any name in ‘Columns’ and click on ‘Statistics’ tick on Chi-square test and Expected cell counts. Then click on OK.
The Minitab output is:
Chi-Square Test for Association: Party, spent
Rows: Party Columns: spent
| <5B | 5-10B | >10B | |
| Democratic | 9.78 | 16.63 | 18.59 |
| Republican | 10.22 | 17.37 | 19.41 |
Cell Contents
Expected count
Chi-Square Test
| Chi-Square | DF | P-Value | |
| Pearson | 2.176 | 2 | 0.337 |
| Likelihood Ratio | 2.185 | 2 | 0.335 |
Therefore, the obtained Chi-square test statistics is 2.176.
The obtained expected frequencies are:
| Party | <5B | 5-10B | >10B |
| Democratic | 9.78 | 16.63 | 18.59 |
| Republican | 10.22 | 17.37 | 19.41 |
So, all expected frequencies are greater than 5.
The chi-square distribution should be used in this study and the obtained degrees of freedom are 2.
(c)
The P-value of the sample statistic.
(c)
Answer to Problem 18P
Solution: The P-value of sample statistic is 0.337.
Explanation of Solution
Calculation: The Minitab output obtained in above part (b) also gives the P-value. So, the P-value for the sample test statistic is 0.337.
(d)
To explain: Whether we will reject or fails to reject the null hypothesis.
(d)
Answer to Problem 18P
Solution: We failed to reject the null hypothesis at significance level 0.05.
Explanation of Solution
The obtained results in part (a), (b) and (c) are,
Since the P-value (0.337) is greater than 0.01, hence we failed to reject the null hypothesis of independence at
(e)
To explain: The conclusion in the context of application.
(e)
Answer to Problem 18P
Solution: It is concluded that the Stone tools construction material and sitearenot independent.
Explanation of Solution
From above part, it can be seen that we failed to reject the null hypothesis at
Therefore, at the 1% level of significance, there is sufficient evidence to conclude that congressional members of each political party spent designated amounts in the same proportions.
Want to see more full solutions like this?
Chapter 11 Solutions
Student Solutions Manual for Brase/Brase's Understanding Basic Statistics, 7th


- Using the toddler data table in Question 1, describe the toddlers in the sample with joint probabilities only. (300) B(K)-00+300 501 30 smot dbabib (oor de leng 001-009:(00s) 200, yoogie Fox (D) ed to diman edarrow_forwardRight-Handed Left-Handed 24 Gender Males 4 Females 2 12arrow_forwardappropriate probabilities. 19 Using the data from Table 17-1, are gender and political party independent for this group? nis cow sib signia si Falows grillor le pussarrow_forward
- 11 Using the same toddler data, describe the toddlers with marginal probabilities only. BAY bit of benoliesmas (89 abje' jook stages of te cojota ing ou an out of to cojota ovig ber el ba 3+4=029arrow_forward21 Using the data from the table in Question 1, does the dominant hand differ for male toddlers versus female toddlers? (In other words, are these two events dependent?)arrow_forwardop In a two-way table with variables A and B, does P(A|B) + P(A|B) = 1? பே 69 6 work as m 3 atavs ow to portabagabat sot gaisarrow_forward
- In a two-way table with variables A and B, does P(A|B)+P(A|B)=1? dsins/Ispino936) 1 durab ALED a to gilidadost Earrow_forwardpreference are dependent (you even have to look at the males). Using the bumper sticker data in the first example problem in this chapter, are car age and number of bumper stickers related (In other words, are these two events dependent?) d insbusqabni oss agit ads bms gliw woy tadi validadong ada 15W wex s m ad ow MP gliw Boy 1st yilidadong at al terW .d Shsed smo viaxe 5X9 of pe 012 from 12 or to HOM qose Aunt swam to prepants M&arrow_forward23 வ dous biops Which marginal probabilities that you find in a two-way table should sum to 1? 著arrow_forward
- Using the toddler data from the table in Question 1 and appropriate probability notation, do the following: a. Compare the right-handed female and male toddlers in the sample, using condi- tional probabilities (only). b. Compare the right-handed toddlers asid in the sample, using conditional probabilities (only).dependent abni sis & bas bax bensqged snavs med) galworl andarrow_forwardUsing the toddler data from the table in Question 1 and appropriate probability notation, identify and calculate the following: a. What percentage of the male toddlers are right-handed? te b. What percentage of the female toddlers are right-handed? c. What percentage of the right-handed toddlers are male? d. What percentage of the right-handed toddlers are female?arrow_forward10 Using the toddler data from the table in Question 1 and the appropriate probability Tonotation, identify and calculate ther s following: a. What percentage of the toddlers are right-handed? b. now to What percentage of the toddlers are female? female? da boit vom wo c. What proportion of the toddlers are left-handed? d. What's the chance of finding a male toddler from the sample? [10arrow_forward
 College Algebra (MindTap Course List)AlgebraISBN:9781305652231Author:R. David Gustafson, Jeff HughesPublisher:Cengage Learning
 Glencoe Algebra 1, Student Edition, 9780079039897...AlgebraISBN:9780079039897Author:CarterPublisher:McGraw Hill