Videos
The spreadsheet summarizes the results for one student on a 15-question math test with partial credit awarded.
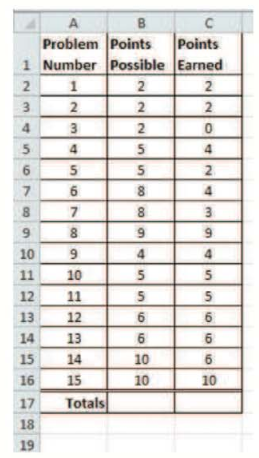
Complete the totals at the bottom of each column using addition.
To calculate: The total of possible points and points earned in the following table:
| Problem number | Points possible | Points earned |
| 1 | 2 | 2 |
| 2 | 2 | 2 |
| 3 | 2 | 0 |
| 4 | 5 | 4 |
| 5 | 5 | 2 |
| 6 | 8 | 4 |
| 7 | 8 | 3 |
| 8 | 9 | 9 |
| 9 | 4 | 4 |
| 10 | 5 | 5 |
| 11 | 5 | 5 |
| 12 | 6 | 6 |
| 13 | 6 | 6 |
| 14 | 10 | 6 |
| 15 | 10 | 10 |
| Totals |
Answer to Problem 1G
Solution:
The total of possible points is
Explanation of Solution
Given Information:
The provided table shows points earned by a student in
| Problem number | Points possible | Points earned |
| 1 | 2 | 2 |
| 2 | 2 | 2 |
| 3 | 2 | 0 |
| 4 | 5 | 4 |
| 5 | 5 | 2 |
| 6 | 8 | 4 |
| 7 | 8 | 3 |
| 8 | 9 | 9 |
| 9 | 4 | 4 |
| 10 | 5 | 5 |
| 11 | 5 | 5 |
| 12 | 6 | 6 |
| 13 | 6 | 6 |
| 14 | 10 | 6 |
| 15 | 10 | 10 |
| Totals |
Calculation:
The total of possible points is sum of all the numbers in the column of possible points.
That is,
Now, the total earned points is sum of all the numbers in the column of earned points.
That is,
Therefore, total possible is points is
Want to see more full solutions like this?
Chapter 1 Solutions
Pathways to Math Literacy (Loose Leaf) with Connect Math Hosted by ALEKS


- Find the tangential and normal components of the acceleration vector for the curve - F(t) = (2t, −3t³, −3+¹) at the point t = 1 - ā(1) = T + Ñ Give your answers to two decimal placesarrow_forwardFind the unit tangent vector to the curve defined by (t)=(-2t,-4t, √√49 - t²) at t = −6. T(−6) =arrow_forwardAnswer number twoarrow_forward
- 3. Bayesian Inference – Updating Beliefs A medical test for a rare disease has the following characteristics: Sensitivity (true positive rate): 99% Specificity (true negative rate): 98% The disease occurs in 0.5% of the population. A patient receives a positive test result. Questions: a) Define the relevant events and use Bayes’ Theorem to compute the probability that the patient actually has the disease.b) Explain why the result might seem counterintuitive, despite the high sensitivity and specificity.c) Discuss how prior probabilities influence posterior beliefs in Bayesian inference.d) Suppose a second, independent test with the same accuracy is conducted and is also positive. Update the probability that the patient has the disease.arrow_forwardanswer number 6arrow_forwardanswer number 2arrow_forward
- 4. Linear Regression - Model Assumptions and Interpretation A real estate analyst is studying how house prices (Y) are related to house size in square feet (X). A simple linear regression model is proposed: The analyst fits the model and obtains: • Ŷ50,000+150X YBoB₁X + € • R² = 0.76 • Residuals show a fan-shaped pattern when plotted against fitted values. Questions: a) Interpret the slope coefficient in context. b) Explain what the R² value tells us about the model's performance. c) Based on the residual pattern, what regression assumption is likely violated? What might be the consequence? d) Suggest at least two remedies to improve the model, based on the residual analysis.arrow_forward5. Probability Distributions – Continuous Random Variables A factory machine produces metal rods whose lengths (in cm) follow a continuous uniform distribution on the interval [98, 102]. Questions: a) Define the probability density function (PDF) of the rod length.b) Calculate the probability that a randomly selected rod is shorter than 99 cm.c) Determine the expected value and variance of rod lengths.d) If a sample of 25 rods is selected, what is the probability that their average length is between 99.5 cm and 100.5 cm? Justify your answer using the appropriate distribution.arrow_forward2. Hypothesis Testing - Two Sample Means A nutritionist is investigating the effect of two different diet programs, A and B, on weight loss. Two independent samples of adults were randomly assigned to each diet for 12 weeks. The weight losses (in kg) are normally distributed. Sample A: n = 35, 4.8, s = 1.2 Sample B: n=40, 4.3, 8 = 1.0 Questions: a) State the null and alternative hypotheses to test whether there is a significant difference in mean weight loss between the two diet programs. b) Perform a hypothesis test at the 5% significance level and interpret the result. c) Compute a 95% confidence interval for the difference in means and interpret it. d) Discuss assumptions of this test and explain how violations of these assumptions could impact the results.arrow_forward
 Algebra: Structure And Method, Book 1AlgebraISBN:9780395977224Author:Richard G. Brown, Mary P. Dolciani, Robert H. Sorgenfrey, William L. ColePublisher:McDougal Littell
 Big Ideas Math A Bridge To Success Algebra 1: Stu...AlgebraISBN:9781680331141Author:HOUGHTON MIFFLIN HARCOURTPublisher:Houghton Mifflin Harcourt
 Elementary AlgebraAlgebraISBN:9780998625713Author:Lynn Marecek, MaryAnne Anthony-SmithPublisher:OpenStax - Rice University