
(a)
The market demand curve, price, and output under the monopolist.
(a)
Explanation of Solution
The market demand curve for Otters is given as
The marginal revenue of the market can be derived as follows:
The market marginal revenue is
By substituting the value of Q in the demand equation, the
Thus, the market demand curve can be illustrated as follows:
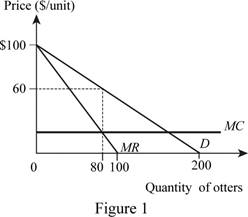
The monopoly output and price are 80 units and $60 per unit.
Imperfect competition: The imperfect competition is the market structure where there are many sellers selling the differentiated products and there will be information asymmetry in the market which provides some market control to the producers.
(b)
The output in the market by A.
(b)
Explanation of Solution
When firm J announces that half of the monopoly output would be brought by J, firm J would bring 40 units. By knowing this, the residual demand for A can be calculated as follows:
Inverse demand equation (Price) for firm A can be calculated as follows:
Thus, the marginal revenue curve of A will be
Thus, A's profit maximizing output would be 60 units.
(c)
Industrial output, price, and each seller's profit.
(c)
Explanation of Solution
The output by J is 40 units and the output by A is 60 units, which means that the total industrial output would be the summation of these two which is equal to 100 units. The price can be calculated by substituting the values of the two quantities in the demand function as follows:
Thus, the price of the market would be $50 per unit. Thus, the profit of each seller can be calculated as follows:
Similarly, the profit of A can be calculated as follows:
Thus, the profit of A is $1,800 and that of J is $1,200.
(d)
Industrial output, price, and each seller's profit.
(d)
Explanation of Solution
When firm J knows that the output brought by A is 60 units, the residual demand for the J can be calculated as follows:
Inverse demand equation (Price) for firm J can be calculated as follows:
Thus, the marginal revenue curve of J will be
Thus, J's profit maximizing output would be 50 units. The output by J is 50 units and the output by A is 60 units, which means that the total industrial output would be the summation of these two which is equal to 110 units. The price can be calculated by substituting the values of the two quantities in the demand function as follows:
Thus, the price of the market would be $45 per unit. Thus, the profit of each seller can be calculated as follows:
Similarly, the profit of A can be calculated as follows:
Thus, the profit of A is $1,500 and that of J is $1,250.
(e)
Cournot equilibrium in the economy.
(e)
Explanation of Solution
The market demand curve is
The marginal revenue of firm J can be calculated as follows:
Thus, the marginal revenue curve for J will be
The marginal revenue of firm A can be calculated as follows:
Thus, the marginal revenue curve for J will be
Similarly, A can be calculated as follows:
Thus, by substituting the reaction function of A in J the equilibrium output can be provided as follows:
Since A also faces the identical problem, the output of A will also be 53.33. Thus, the total output is 106.66 and this can be substituted in the market demand in order to calculate the market price as follows:
Thus, the Cournot equilibrium price is $46.67 and the output is 53.33. Since part d calculated the outputs and prices that are different, they are not Cournot equilibrium prices and outputs.
Want to see more full solutions like this?
Chapter 11 Solutions
EBK MICROECONOMICS

- What are the 4 main parts of circular diagram?arrow_forwardWhat is absolute advantage?arrow_forwardGood Day, Kindly requesting assistance with this also Briefly explain how elasticity affects government health policies in the following cases:● Taxes on unhealthy products (cigarettes, alcohol, sugary drinks)● Subsidizing Preventive Care (e.g., vaccines, screenings)● Drug Price Controls & Generic Substitutions● Co-Payments & Insurance Designarrow_forward
- Good Day, Kindly assist with the following query: ● Cost–benefit Analysis● Cost-effectiveness analysis● Cost–utility analysis● Cost analysis or Cost Minimization Analysis For each of the following health policy questions listed below, identify and briefly explain which type of economic evaluation in question above would be most appropriate to use: ● The Ministry of Finance wants to know whether it is worth investing further resources into malaria control or building new primary schools? ● The Ministry of Health wants to compare the costs of receiving intravenous antibiotics in a hospital with receiving the same antibiotics (at the same doses) at home via a home health care service. ● The Ministry of Health wants to compare the costs and outcomes of two interventions for the treatment of early stage breast cancer: mastectomy without breast reconstruction compared to breast conserving surgery and radiotherapy (breast conservation). ● A malaria control programme wants to use economic…arrow_forwardSubstitute X=20. Can you show me how to do question 1 pleasearrow_forwardBlue Air Inc., has net sales of $740,000 and accounts receivables of $163,000. What is the firm's accounts receivables turnover?arrow_forward
- Please answer questions D-H, I have already answered A , B,C but it may help you to still solve them yourself. Thank you!arrow_forward2. A firm’s production function is given by:Q = 10KLThe unit capital and labour costs are 2 and 1 pounds respectively. The firm is contracted to produce2000 units.(a) Write out the optimisation problem of the firm. (b) Express this problem using a Lagrangian function. (c) Find values of K and L which fulfil the contract with minimal cost to the firm. (d) Calculate the total cost to the firm.arrow_forward3. Consider the following estimated regression equation, estimated using a sample of firms, where RDis total firm spending on research and development in USD ($), Revenue is total firm revenuein USD ($), and W ages is the firms’ total spending on wages in USD ($) (standard errors inparentheses):RDd = 1000(600)+ 0.5(0.1)Revenue + 1.5(0.5)W ages,(a) Interpret the coefficients on each of the explanatory variables. (b) Which of the three coefficients are statistically significant at the 5% level of significance? Howdo you know? A researcher runs a two-sided statistical test of the null hypothesis that both the coefficients onthe explanatory variables above are jointly equal to 0.25 (mathematically, that β1 = β2 = 0.25),and reports a p-value of 0.045.(c) What does this p-value mean for the outcome of the test? (d) What would an appropriate two-sided alternative hypothesis look like?arrow_forward

 Principles of Economics (12th Edition)EconomicsISBN:9780134078779Author:Karl E. Case, Ray C. Fair, Sharon E. OsterPublisher:PEARSON
 Engineering Economy (17th Edition)EconomicsISBN:9780134870069Author:William G. Sullivan, Elin M. Wicks, C. Patrick KoellingPublisher:PEARSON
 Principles of Economics (MindTap Course List)EconomicsISBN:9781305585126Author:N. Gregory MankiwPublisher:Cengage Learning
 Managerial Economics: A Problem Solving ApproachEconomicsISBN:9781337106665Author:Luke M. Froeb, Brian T. McCann, Michael R. Ward, Mike ShorPublisher:Cengage Learning
 Managerial Economics & Business Strategy (Mcgraw-...EconomicsISBN:9781259290619Author:Michael Baye, Jeff PrincePublisher:McGraw-Hill Education