
Concept explainers
Videos
Application Exercises
The graphs show the percentage of high school seniors who had ever used alcohol or marijuana.
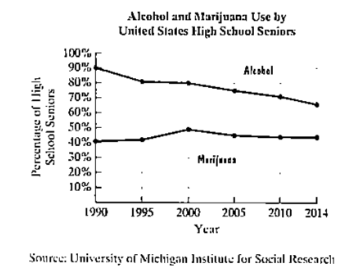
The data can be described by the following mathematical models:

Use this information to solve Exercises 55–56.
a. Use the appropriate line graph to estimate the percentage of seniors who used alcohol in 2014.
b. Use the appropriate formula to determine the percentage of seniors who used alcohol in 2014. How does this compare with your estimate in part (a)?
c. Use the appropriate line graph to estimate the percentage of seniors who used marijuana in 2014.
d. Use the appropriate formula to determine the percentage of seniors who used marijuana in 2014. How does this compare with your estimate in part (c)?
e. For the period from 1990 through 2014, in which year was alcohol use by seniors at a maximum? What percentage of seniors used alcohol in that year.
Want to see the full answer?
Check out a sample textbook solution
Chapter 1 Solutions
College Algebra (7th Edition)


- please Solve questions by Course Name( Ordinary Differential Equations II 2)arrow_forwardInThe Northern Lights are bright flashes of colored light between 50 and 200 miles above Earth. Suppose a flash occurs 150 miles above Earth. What is the measure of arc BD, the portion of Earth from which the flash is visible? (Earth’s radius is approximately 4000 miles.)arrow_forwarde). n! (n - 1)!arrow_forward
- Suppose you flip a fair two-sided coin four times and record the result. a). List the sample space of this experiment. That is, list all possible outcomes that could occur when flipping a fair two-sided coin four total times. Assume the two sides of the coin are Heads (H) and Tails (T).arrow_forwarde). n! (n - 1)!arrow_forwardEvaluate the following expression and show your work to support your calculations. a). 6! b). 4! 3!0! 7! c). 5!2! d). 5!2! e). n! (n - 1)!arrow_forward
- Amy and Samiha have a hat that contains two playing cards, one ace and one king. They are playing a game where they randomly pick a card out of the hat four times, with replacement. Amy thinks that the probability of getting exactly two aces in four picks is equal to the probability of not getting exactly two aces in four picks. Samiha disagrees. She thinks that the probability of not getting exactly two aces is greater. The sample space of possible outcomes is listed below. A represents an ace, and K represents a king. Who is correct?arrow_forwardConsider the exponential function f(x) = 12x. Complete the sentences about the key features of the graph. The domain is all real numbers. The range is y> 0. The equation of the asymptote is y = 0 The y-intercept is 1arrow_forwardThe graph shows Alex's distance from home after biking for x hours. What is the average rate of change from -1 to 1 for the function? 4-2 о A. -2 О B. 2 О C. 1 O D. -1 ty 6 4 2 2 0 X 2 4arrow_forward
 Trigonometry (MindTap Course List)TrigonometryISBN:9781337278461Author:Ron LarsonPublisher:Cengage Learning
 Glencoe Algebra 1, Student Edition, 9780079039897...AlgebraISBN:9780079039897Author:CarterPublisher:McGraw Hill