
1.
Develop a schematic diagram of the two-stage production process.
1.
Explanation of Solution
Develop a schematic diagram of the two-stage production process:
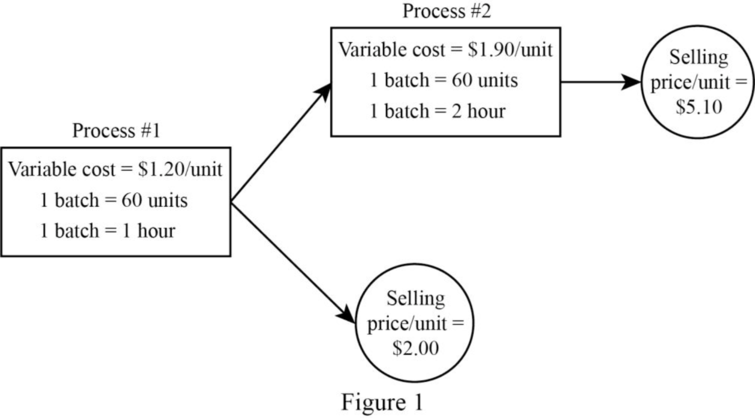
Figure (1)
Note: In this case, the manufacturing
2.
Compute the following:
- a. Contribution margin per hour for output from Process 1.
- b. Contribution margin per hour for output from Process 2.
- c. The implication of the given information, if the goal of the company is to maximize shorttermoperating income.
2.
Explanation of Solution
In this case, the number of processing hours (Scarce resource)is limited,so the short-term objective would be to maximize the contribution margin per hour of processing time. Contribution margin per hour for output from Process 1 and Process 2 are as follows:
| Particulars | Process 1 | Process 2 |
| Net selling price per unit (a) | $ 2 | $ 5.10 |
| Less: Cost of goods sold | ||
| Direct material cost per unit | $ 1.00 | $ 1.50 |
| Direct labor cost per unit | $ 0.20 | $ 0.40 |
| Transferred in costs from process 1 | $ 0.00 | $ 1.20 |
| Total variable cost per unit (b) | $ 1.20 | $ 3.10 |
| Contribution margin per unit | $ 0.80 | $ 2.00 |
| Number of hours per unit (d) | ||
| 0.0167 | ||
| 0.0500 | ||
| Contribution margin per unit | $ 47.90 | $ 40.00 |
Table (1)
From the above calculation, it is clear that Contribution margin per unit of Process 1 output is more profitable than output from Process 2. Therefore, the short-run operating income would be maximized if all available hours were used to produce Process #1 output.
3.
Compute the lowest acceptable selling price per unit for the output from Process 2 to make this output as profitable as the output from Process 1.
3.
Explanation of Solution
Compute the lowest acceptable selling price per unit for the output from Process 2 to make this output as profitable as the output from Process 1:
| Particulars | Process 1 | Process 2 |
| Current selling price per unit | $5.10 per unit | |
| The required increase in profitability per processing hour | $ 8 | |
| Multiply by:One unit of output from Process 2 requires | 0.05 hours | |
| Increase in selling price | $0.40 | |
| Minimum selling pricethe output from Process 2 | $5.50 per unit |
Table (2)
4.
Compute the following, by Assuming that 50% of the total overhead costs are variable:
- a. Revised Contribution margin per hour for output from Process 1.
- b. RevisedContribution margin per hour for output from Process 2.
- c. Describe whether the answer computed in requirement 2 changes, based on these revised calculations.
4.
Explanation of Solution
Compute the given by Assuming that 50% of the total overhead costs are variable:
| Particulars | Process 1 | Process 2 |
| Net selling price per unit (a) | $ 2 | $ 5.10 |
| Less: Cost of goods sold | ||
| Direct material cost per unit | $ 1.00 | $ 1.50 |
| Direct labor cost per unit | $ 0.20 | $ 0.40 |
| Variable overhead @50% | $0.30 | $0.60 |
| Transferred in costs from process 1 | $ 0.00 | $ 1.50 |
| Total variable cost per unit (b) | $ 1.50 | $4.00 |
| Contribution margin per unit | $ 0.50 | $1.10 |
| Number of hours per unit (d) | ||
| 0.0167 | ||
| 0.0500 | ||
| Contribution margin per unit | $29.94 | $22.00 |
Table (3)
From the above calculation, it is clear that the conclusion reached above in Requirement 2 still holds.
5.
- a. Calculate the contribution margin per processing hour using the sensitivity analysis for both Process 1 output and Process 2 output under the given assumptions regarding thepercentage of variable overhead costs: 0%, 25%, 50%, and 100%. Perform these calculations for Process2 output both for a selling price of $5.10 per unit and a selling price of $5.50 per unit.
- b. State the generalconclusion that could be drawn on the basis of this sensitivity analysis.
5.
Explanation of Solution
| Contribution margin or processing hour | ||||||
| % VOH | ||||||
| P1 | P2 | Δ | P1 | P2 | Δ | |
| 0% | $48.00 | $40.00 | $4.00 | $48.00 | $58.00 | $10.00 |
| 25% | $39.00 | $31.00 | $8.00 | $39.00 | $49.00 | $10.00 |
| 50% | $30.00 | $22.00 | $8.00 | $30.00 | $40.00 | $10.00 |
| 100% | $12.00 | $4.00 | $8.00 | $12.00 | $22.00 | $10.00 |
Table (4)
In this case, the sensitivity analysis aidsto explain the result obtained in Requirement 4, and when Process #2 output uses three times as much processing time per unit, whencompared to Process #1. This is independent of selling prices and the composition of variable overhead. Moreover, the amount of variable overhead charged per unit of Process #2 output is always three times as much variable overhead charged per unit of output from Process #1.
Since these ratios are “constant across selling prices per unit for output from Process #2 and also constant across levels of variable overhead, the difference in contribution margin per hour between Process #1 and Process #2 output, at each assumed selling price per unit for Process #2 output, will be constant and independent of the proportion of total overhead that is variable”.
Want to see more full solutions like this?
Chapter 11 Solutions
COST MANAGMENT WITH CONNECT ACCESS

- Hi expert please given correct answerarrow_forwardSolve with explanation and accounting questionarrow_forwardBoston Supplies had cash sales of $78,450, credit sales of $45,670, sale returns and allowances of $6,890, and sales discounts of $3,750. What is the company's net sales for this period?arrow_forward
- What is the company's net sales for this period?arrow_forwardWhat is the primary purpose of preparing a trial balance? a) To calculate net profit or lossb) To check the mathematical accuracy of the ledger accountsc) To prepare the income statementd) To report cash flowsarrow_forwardMachinery was purchased for $78,500 on January 1, 2018. Shipping costs were $2,200 and installation expenses totaled $4,300. It is estimated that the machinery will have a $15,000 salvage value at the end of its 8-year useful life. What is the amount of accumulated depreciation on December 31, 2020, if the straight-line method of depreciation is used?arrow_forward

 AccountingAccountingISBN:9781337272094Author:WARREN, Carl S., Reeve, James M., Duchac, Jonathan E.Publisher:Cengage Learning,
 Accounting Information SystemsAccountingISBN:9781337619202Author:Hall, James A.Publisher:Cengage Learning,
 Horngren's Cost Accounting: A Managerial Emphasis...AccountingISBN:9780134475585Author:Srikant M. Datar, Madhav V. RajanPublisher:PEARSON
 Intermediate AccountingAccountingISBN:9781259722660Author:J. David Spiceland, Mark W. Nelson, Wayne M ThomasPublisher:McGraw-Hill Education
 Financial and Managerial AccountingAccountingISBN:9781259726705Author:John J Wild, Ken W. Shaw, Barbara Chiappetta Fundamental Accounting PrinciplesPublisher:McGraw-Hill Education