
To describe:
The equilibrium of the economics graphically.
Marginal propensity for the consumption and the multiplier.
Effect on equilibrium GDP when the price level remain unchanged and government purchases reduced by 60$.
Answer to Problem 2TY
When the government expenditure is reduced by 60$ it leads to the change in the equilibrium level by 120$. Thus, the multiplier effect of govt. purchases on GDP will be 2.
Explanation of Solution
The GDP equilibrium is the equilibrium output of such an economy is that level of output at which the total amount of planned spending is just equal to the amount produced, or GDP. That is, equilibrium
The Economic equilibrium is a condition or state wherein economic powers are adjusted. Economic equilibrium is the mix of economic variables (typically cost and amount) toward which ordinary economic procedures, for example, market interest, drive the economy.
The given below table represents the components of consumption expenditure (Table I)
| GDP | Taxes | DI | C | I | G | (X-IM) |
| 1360 | 320 | 1040 | 810 | 200 | 500 | 30 |
| 1480 | 360 | 1120 | 870 | 200 | 500 | 30 |
| 1600 | 400 | 1200 | 930 | 200 | 500 | 30 |
| 1720 | 440 | 1280 | 990 | 200 | 500 | 30 |
| 1840 | 480 | 1360 | 1050 | 200 | 500 | 30 |
Now employing the information in the above table the consumption expenditure will be composed where consumption expenditure will be given as the sum of C, I, G and
| GDP | Taxes | DI | C | I | G | (X-IM) | Consumption expenditure |
| 1360 | 320 | 1040 | 810 | 200 | 500 | 30 | 1540 |
| 1480 | 360 | 1120 | 870 | 200 | 500 | 30 | 1600 |
| 1600 | 400 | 1200 | 930 | 200 | 500 | 30 | 1660 |
| 1720 | 440 | 1280 | 990 | 200 | 500 | 30 | 1720 |
| 1840 | 480 | 1360 | 1050 | 200 | 500 | 30 | 1780 |
In table 2, the GDP of the economy is equal to that Consumption expenditure when both are 1720$, thus the equilibrium level of GDP is 1720$.
The tax rate can be calculated employing the formula :
The tax rate can be represented in the table (2) as,
| GDP/Income | Tax | Tax rate |
| 1360 | 320 | 23.53 |
| 1480 | 360 | 24.32 |
| 1600 | 400 | 25 |
| 1720 | 440 | 25.58 |
| 1840 | 480 | 26.09 |
| 24.90(124.52/5) |
Thus the average tax rate is 24.90.
The reduction in govt purchase by 60$ will reduce the consumption expenditure. Thus, the new equilibrium level of GDP can be obtained through updating the figure with the new govt. purchases.
| GDP | C | I | G | (X-IM) | Consumption expenditure |
| 1360 | 810 | 200 | 440 | 30 | 1480 |
| 1480 | 870 | 200 | 440 | 30 | 1540 |
| 1600 | 930 | 200 | 440 | 30 | 1600 |
| 1720 | 990 | 200 | 440 | 30 | 1660 |
| 1840 | 1050 | 200 | 440 | 30 | 1720 |
Since the consumption expenditure is equal to that of GDP when both values are at 1600$, the equilibrium level of GDP is 1600. It shows that the reduction in government purchases by 60$ will lead to reduction of equilibrium level by 120.
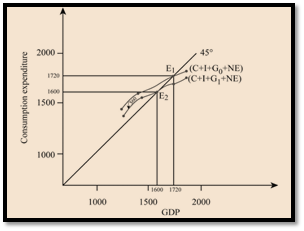
Graphical representation of equilibrium level of GDP : The graph shows the govt expenditure shifted the consumption expenditure curve downward from
Introduction:
Economic equilibrium is a condition or state wherein economic powers are adjusted. Economic equilibrium is the mix of economic variables (typically cost and amount) toward which ordinary economic procedures, for example, market interest, drive the economy.
Want to see more full solutions like this?
Chapter 11 Solutions
Macroeconomics: Principles and Policy (MindTap Course List)

- Your marketing department has identified the following customer demographics in the following table. Construct a demand curve and determine the profit maximizing price as well as the expected profit if MC=$1. The number of customers in the target population is 10,000. Use the following demand data: Group Value Frequency Baby boomers $5 20% Generation X $4 10% Generation Y $3 10% `Tweeners $2 10% Seniors $2 10% Others $0 40%arrow_forwardYour marketing department has identified the following customer demographics in the following table. Construct a demand curve and determine the profit maximizing price as well as the expected profit if MC=$1. The number of customers in the target population is 10,000. Group Value Frequency Baby boomers $5 20% Generation X $4 10% Generation Y $3 10% `Tweeners $2 10% Seniors $2 10% Others $0 40% ur marketing department has identified the following customer demographics in the following table. Construct a demand curve and determine the profit maximizing price as well as the expected profit if MC=$1. The number of customers in the target population is 10,000.arrow_forwardTest Preparation QUESTION 2 [20] 2.1 Body Mass Index (BMI) is a summary measure of relative health. It is calculated by dividing an individual's weight (in kilograms) by the square of their height (in meters). A small sample was drawn from the population of UWC students to determine the effect of exercise on BMI score. Given the following table, find the constant and slope parameters of the sample regression function of BMI = f(Weekly exercise hours). Interpret the two estimated parameter values. X (Weekly exercise hours) Y (Body-Mass index) QUESTION 3 2 4 6 8 10 12 41 38 33 27 23 19 Derek investigates the relationship between the days (per year) absent from work (ABSENT) and the number of years taken for the worker to be promoted (PROMOTION). He interviewed a sample of 22 employees in Cape Town to obtain information on ABSENT (X) and PROMOTION (Y), and derived the following: ΣΧ ΣΥ 341 ΣΧΥ 176 ΣΧ 1187 1012 3.1 By using the OLS method, prove that the constant and slope parameters of the…arrow_forward
- QUESTION 2 2.1 [30] Mariana, a researcher at the World Health Organisation (WHO), collects information on weekly study hours (HOURS) and blood pressure level when writing a test (BLOOD) from a sample of university students across the country, before running the regression BLOOD = f(STUDY). She collects data from 5 students as listed below: X (STUDY) 2 Y (BLOOD) 4 6 8 10 141 138 133 127 123 2.1.1 By using the OLS method and the information above derive the values for parameters B1 and B2. 2.1.2 Derive the RSS (sum of squares for the residuals). 2.1.3 Hence, calculate ô 2.2 2.3 (6) (3) Further, she replicates her study and collects data from 122 students from a rival university. She derives the residuals followed by computing skewness (S) equals -1.25 and kurtosis (K) equals 8.25 for the rival university data. Conduct the Jacque-Bera test of normality at a = 0.05. (5) Upon tasked with deriving estimates of ẞ1, B2, 82 and the standard errors (SE) of ẞ1 and B₂ for the replicated data.…arrow_forwardIf you were put in charge of ensuring that the mining industry in canada becomes more sustainable over the course of the next decade (2025-2035), how would you approach this? Come up with (at least) one resolution for each of the 4 major types of conflict: social, environmental, economic, and politicalarrow_forwardHow is the mining industry related to other Canadian labour industries? Choose one other industry, (I chose Forestry)and describe how it is related to the mining industry. How do the two industries work together? Do they ever conflict, or do they work well together?arrow_forward
- What is the primary, secondary, tertiary, and quaternary levels of mining in Canada For each level, describe what types of careers are the most common, and describe what stage your industry’s main resource is in during that stagearrow_forwardHow does the mining industry in canada contribute to the Canadian economy? Describe why your industry is so important to the Canadian economy What would happen if your industry disappeared, or suffered significant layoffs?arrow_forwardWhat is already being done to make mining in canada more sustainable? What efforts are being made in order to make mining more sustainable?arrow_forward
- What are the environmental challenges the canadian mining industry face? Discuss current challenges that mining faces with regard to the environmentarrow_forwardWhat sustainability efforts have been put forth in the mining industry in canada Are your industry’s resources renewable or non-renewable? How do you know? Describe your industry’s reclamation processarrow_forwardHow does oligopolies practice non-price competition in South Africa?arrow_forward


 Economics (MindTap Course List)EconomicsISBN:9781337617383Author:Roger A. ArnoldPublisher:Cengage Learning