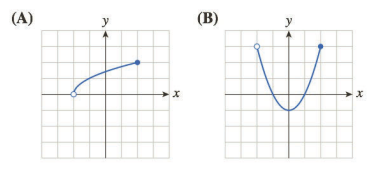
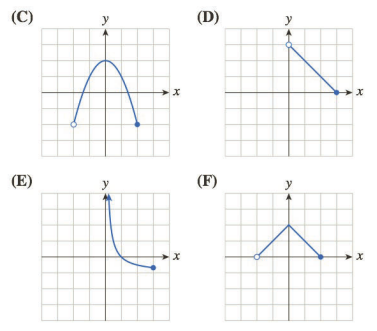
Problem 1E: In Exercises 1-4, evaluate each expression based on the following table. [Hint: See Quick Example... Problem 2E: In Exercises 1-4, evaluate each expression based on the following table. [Hint: See Quick Example... Problem 3E: In Exercises 1-4, evaluate each expression based on the following table. [Hint: See Quick Example... Problem 4E: In Exercises 1-4, evaluate each expression based on the following table. [Hint: See Quick Example... Problem 5E: In Exercises 5-8, use the graph of the function f to find approximations of the given values. [HINT:... Problem 6E: In Exercises 5-8, use the graph of the function f to find approximations of the given values. [HINT:... Problem 7E: In Exercises 5-8, use the graph of the function f to find approximations of the given values. [HINT:... Problem 8E: In Exercises 5-8, use the graph of the function f to find approximations of the given values. [HINT:... Problem 9E: In Exercises 9-12, say whether or not f(x) is defined for the given values of x. If it is defined,... Problem 10E: In Exercises 9-12, say whether or not f(x) is defined for the given values of x. If it is defined,... Problem 11E: In Exercises 9-12, say whether or not f(x) is defined for the given values of x. If it is defined,... Problem 12E: In Exercises 9-12, say whether or not f(x) is defined for the given values of x. If it is defined,... Problem 13E: Given f(x)=4x3, find a. f(1) b. f(0) c. f(1) d. f(y) e. f(a+b) [Hint: See Example 1] Problem 14E: Given f(x)=3x+4, find a. f(1) b. f(0) c. f(1) d. f(y) e. f(a+b) Problem 15E: Given f(x)=x2+2x+3, find a. f(0) b. f(1) c. f(1) d. f(3) e. f(a) f. f(x+h) [Hint: See Example 1] Problem 16E: Given g(x)=2x2x+1, find a. g(0) b. g(1) c. g(r) d. g(x+h) Problem 17E: Given g(s)=s2+1s, find a. g(1) b. g(1) c. g(4) d. g(x) e. g(s+h) f. g(s+h)g(s) Problem 18E: Given h(r)=1r+4, find a. h(0) b. h(3) c. h(5) d. h(x2) e. h(x2+1) f. h(x2)+1 Problem 19E: In Exercises 19-24, graph the given functions. Give the technology formula, and use technology to... Problem 20E: In Exercises 19-24, graph the given functions. Give the technology formula, and use technology to... Problem 21E: In Exercises 19-24, graph the given functions. Give the technology formula, and use technology to... Problem 22E: In Exercises 19-24, graph the given functions. Give the technology formula, and use technology to... Problem 23E: In Exercises 19-24, graph the given functions. Give the technology formula, and use technology to... Problem 24E: In Exercises 19-24, graph the given functions. Give the technology formula, and use technology to... Problem 25E: In Exercises 25 and 26, match the functions to the graphs. (The gridlines an 1 unit apart.) Using... Problem 26E: In Exercises 25 and 26, match the functions to the graphs. (The gridlines an 1 unit apart.) Using... Problem 27E: In Exercises 27-30, first give the technology formula for the given function, and then use... Problem 28E: In Exercises 27-30, first give the technology formula for the given function, and then use... Problem 29E: In Exercises 27-30, first give the technology formula for the given function, and then use... Problem 30E: In Exercises 27-30, first give the technology formula for the given function, and then use... Problem 31E: In Exercises 31-36, sketch the graph of the given/unction, evaluate the given expressions, and then... Problem 32E: In Exercises 31-36, sketch the graph of the given/unction, evaluate the given expressions, and then... Problem 33E: In Exercises 31-36, sketch the graph of the given/unction, evaluate the given expressions, and then... Problem 34E: In Exercises 31-36, sketch the graph of the given/unction, evaluate the given expressions, and then... Problem 35E: In Exercises 31-36, sketch the graph of the given/unction, evaluate the given expressions, and then... Problem 36E: In Exercises 31-36, sketch the graph of the given/unction, evaluate the given expressions, and then... Problem 37E: In Exercises 37-40, find and simplify (a) f(x+h)f(x) (b) f(x+h)f(x)h f(x)=x2 Problem 38E: In Exercises 37-40, find and simplify (a) f(x+h)f(x) (b) f(x+h)f(x)h f(x)=3x1 Problem 39E: In Exercises 37-40, find and simplify (a) f(x+h)f(x) (b) f(x+h)f(x)h f(x)=2x2 Problem 40E: In Exercises 37-40, find and simplify (a) f(x+h)f(x) (b) f(x+h)f(x)h f(x)=x2+x Problem 41E Problem 42E: Offshore Crude Oil Production: Mexico The following table shows daily offshore crude oil production... Problem 43E: Social Website Popularity: Twitter The following table shows the popularity of Twitter among social... Problem 44E: Social Website Popularity: Delicious The following table shows the popularity of Delicious among... Problem 45E: Housing Starts Exercises 45-48 refer to the following graph, which shows the number f(t) of housing... Problem 46E: Housing Starts Exercises 45-48 refer to the following graph, which shows the number f(t) of housing... Problem 47E: Housing Starts Exercises 45-48 refer to the following graph, which shows the number f(t) of housing... Problem 48E: Housing Starts Exercises 45-48 refer to the following graph, which shows the number f(t) of housing... Problem 49E: For which value or values of t is f(t+5)f(t) greatest? Interpret your answer. Problem 50E: For which value of values t is f(t)f(t1) least? Interpret your answer. Problem 51E: Net Income: Casual Apparel In the following graph, n(t) is Abercrombie Fitchs approximate net... Problem 52E: Net Income: Casual Apparel In the following graph, n(t) is Pacific Sunwears approximate net income,... Problem 53E: Funding for NASA: 1958-1966 The percentage of the U.S. federal budget allocated to NASA from 1958 to... Problem 54E: Funding for NASA: 1966-2015 The percentage of the U.S. federal budget allocated to NASA from 1966 to... Problem 55E: Acquisition of Language The percentage p(t) of children who can speak in at least single words by... Problem 56E Problem 57E Problem 58E: Processor Speeds The processor speed, in megahertz (MHz), of Intel processors during the period... Problem 59E: Income Taxes The U.S. federal income tax is a function of taxable income. Write T(x) for the tax... Problem 60E: Income Taxes Repeat Exercise 59 using the following information for tax year 2012: If your taxable... Problem 61E: Complete the following sentence: If the market price m of gold varies with time t, then the... Problem 62E: Complete the following sentence: If weekly profit P is specified as a function of selling price s,... Problem 63E: Complete the following: The function notation for the equation y=4x22 is ___________. Problem 64E: Complete the following: The equation notation for C(t)=0.34t2+0.1t is _____________. Problem 65E: True or false? Every graphically specified function can also be specified numerically. Explain. Problem 66E: True or false? Every algebraically specified function can also be specified graphically. Explain. Problem 67E Problem 68E Problem 69E Problem 70E: Which supplies more information about a situation: a numerical model or an algebraic model? Problem 71E Problem 72E: Why is the following assertion false? If f(2)=2 and f(4)=4, then f(3)=3 . Problem 73E: How do the graphs of two functions differ if they are specified by the same formula but have... Problem 74E Problem 75E Problem 76E: How do the graphs of two functions f and g differ if g(x)=f(x)? (Try an example.) format_list_bulleted


 College AlgebraAlgebraISBN:9781305115545Author:James Stewart, Lothar Redlin, Saleem WatsonPublisher:Cengage Learning
 Algebra & Trigonometry with Analytic GeometryAlgebraISBN:9781133382119Author:SwokowskiPublisher:Cengage
 Glencoe Algebra 1, Student Edition, 9780079039897...AlgebraISBN:9780079039897Author:CarterPublisher:McGraw Hill
 Algebra: Structure And Method, Book 1AlgebraISBN:9780395977224Author:Richard G. Brown, Mary P. Dolciani, Robert H. Sorgenfrey, William L. ColePublisher:McDougal Littell
 Algebra for College StudentsAlgebraISBN:9781285195780Author:Jerome E. Kaufmann, Karen L. SchwittersPublisher:Cengage Learning
 Algebra and Trigonometry (MindTap Course List)AlgebraISBN:9781305071742Author:James Stewart, Lothar Redlin, Saleem WatsonPublisher:Cengage Learning