
Concept explainers
Videos
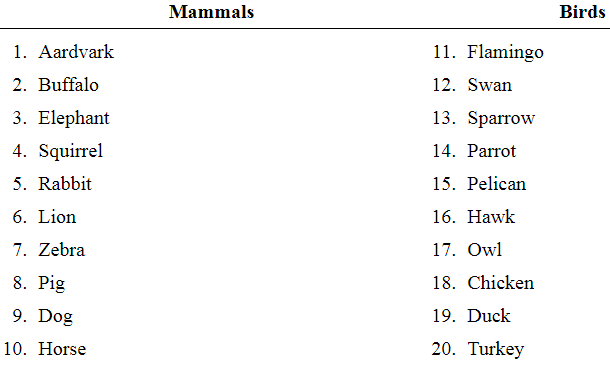
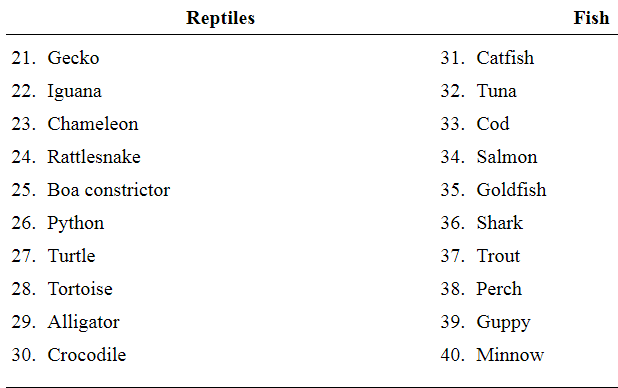
Exercises 21—24 refer to the population of animals in the following table. The population is divided into four groups: mammals, birds, reptiles, and fish.
Another sample: Draw a simple random sample of two groups of animals from the four groups, and construct a sample of 20 animals by including all the animals in the sampled groups. What kind of sample is this?
Tofind:The simple random sample of two groups of animal and the type of sample.
Answer to Problem 23E
The simple random sample of two groups of animal is
Explanation of Solution
Given information:The population is divided into four groups: mammals, birds, reptiles, and fish. Refer to the population of animals in the following table.
| Mammals | Birds | Reptiles | Fish |
| Aardvark Buffalo Elephant Squirrel Rabbit Lion Zebra Pig Dog Horse | 11. Flamingo 12. Swan 13. Sparrow 14. Parrot 15. Pelican 16. Hawk 17. Owl 18. Chicken 19. Duck 20. Turkey | 21. Gecko 22. Iguana 23. Chameleon 24. Rattlesnake 25. Boa constrictor 26. Python 27. Turtle 28. Tortoise 29. Alligator 30. Crocodile | 31. Catfish 32. Tuna 33. Cod 34. Salmon 35. Goldfish 36. Shark 37. Trout 38. Perch 39. Guppy 40. Minnow |
Concept Involved:
If a sample is taken from a population and each item is equally like to make the sample then the sample is called simple random sample.
Calculation:
Since, the items are drawn from the population in groups, or clusters.
Thus, the type of sample is cluster sample.
Consider a simple random sample of two groups of animals from the four groups, and construct a sample of 20 animals by including all the animals in the sampled groups.
| Group | Samples | |
| Mammals | 1 | Aardvark, Buffalo, Elephant, Squirrel, Rabbit, Lion, Zebra, Pig, Dog, Horse |
| Birds | 2 | Flamingo, Swan, Sparrow, Parrot, Pelican, Hawk, Owl, Chicken, Duck, Turkey |
| Reptiles | 3 | Gecko, Iguana, Chameleon, Rattlesnake, Boa constrictor, Python, Turtle, Tortoise, Alligator, Crocodile |
| Fish | 4 | Catfish, Tuna, Cod, Salmon, Goldfish, Shark, Trout, Perch, Guppy, Minnow |
The step-by-step procedure is shown below.
Step 1: Enter any nonzero number on the HOME screen as the seed Step 2: Press Step 3: Press Step 4: Press Then enter Step 5: Press |
Therefore, the simple random sample of two groups of animal is
Want to see more full solutions like this?
Chapter 1 Solutions
Elementary Statistics 2nd Edition
Additional Math Textbook Solutions
Pathways To Math Literacy (looseleaf)
Precalculus: Mathematics for Calculus (Standalone Book)
Elementary and Intermediate Algebra: Concepts and Applications (7th Edition)
Graphical Approach To College Algebra
Calculus for Business, Economics, Life Sciences, and Social Sciences (14th Edition)
Probability And Statistical Inference (10th Edition)


- A researcher wishes to estimate, with 90% confidence, the population proportion of adults who support labeling legislation for genetically modified organisms (GMOs). Her estimate must be accurate within 4% of the true proportion. (a) No preliminary estimate is available. Find the minimum sample size needed. (b) Find the minimum sample size needed, using a prior study that found that 65% of the respondents said they support labeling legislation for GMOs. (c) Compare the results from parts (a) and (b). ... (a) What is the minimum sample size needed assuming that no prior information is available? n = (Round up to the nearest whole number as needed.)arrow_forwardThe table available below shows the costs per mile (in cents) for a sample of automobiles. At a = 0.05, can you conclude that at least one mean cost per mile is different from the others? Click on the icon to view the data table. Let Hss, HMS, HLS, Hsuv and Hмy represent the mean costs per mile for small sedans, medium sedans, large sedans, SUV 4WDs, and minivans respectively. What are the hypotheses for this test? OA. Ho: Not all the means are equal. Ha Hss HMS HLS HSUV HMV B. Ho Hss HMS HLS HSUV = μMV Ha: Hss *HMS *HLS*HSUV * HMV C. Ho Hss HMS HLS HSUV =μMV = = H: Not all the means are equal. D. Ho Hss HMS HLS HSUV HMV Ha Hss HMS HLS =HSUV = HMVarrow_forwardQuestion: A company launches two different marketing campaigns to promote the same product in two different regions. After one month, the company collects the sales data (in units sold) from both regions to compare the effectiveness of the campaigns. The company wants to determine whether there is a significant difference in the mean sales between the two regions. Perform a two sample T-test You can provide your answer by inserting a text box and the answer must include: Null hypothesis, Alternative hypothesis, Show answer (output table/summary table), and Conclusion based on the P value. (2 points = 0.5 x 4 Answers) Each of these is worth 0.5 points. However, showing the calculation is must. If calculation is missing, the whole answer won't get any credit.arrow_forward
- Binomial Prob. Question: A new teaching method claims to improve student engagement. A survey reveals that 60% of students find this method engaging. If 15 students are randomly selected, what is the probability that: a) Exactly 9 students find the method engaging?b) At least 7 students find the method engaging? (2 points = 1 x 2 answers) Provide answers in the yellow cellsarrow_forwardIn a survey of 2273 adults, 739 say they believe in UFOS. Construct a 95% confidence interval for the population proportion of adults who believe in UFOs. A 95% confidence interval for the population proportion is ( ☐, ☐ ). (Round to three decimal places as needed.)arrow_forwardFind the minimum sample size n needed to estimate μ for the given values of c, σ, and E. C=0.98, σ 6.7, and E = 2 Assume that a preliminary sample has at least 30 members. n = (Round up to the nearest whole number.)arrow_forward
- In a survey of 2193 adults in a recent year, 1233 say they have made a New Year's resolution. Construct 90% and 95% confidence intervals for the population proportion. Interpret the results and compare the widths of the confidence intervals. The 90% confidence interval for the population proportion p is (Round to three decimal places as needed.) J.D) .arrow_forwardLet p be the population proportion for the following condition. Find the point estimates for p and q. In a survey of 1143 adults from country A, 317 said that they were not confident that the food they eat in country A is safe. The point estimate for p, p, is (Round to three decimal places as needed.) ...arrow_forward(c) Because logistic regression predicts probabilities of outcomes, observations used to build a logistic regression model need not be independent. A. false: all observations must be independent B. true C. false: only observations with the same outcome need to be independent I ANSWERED: A. false: all observations must be independent. (This was marked wrong but I have no idea why. Isn't this a basic assumption of logistic regression)arrow_forward
- Business discussarrow_forwardSpam filters are built on principles similar to those used in logistic regression. We fit a probability that each message is spam or not spam. We have several variables for each email. Here are a few: to_multiple=1 if there are multiple recipients, winner=1 if the word 'winner' appears in the subject line, format=1 if the email is poorly formatted, re_subj=1 if "re" appears in the subject line. A logistic model was fit to a dataset with the following output: Estimate SE Z Pr(>|Z|) (Intercept) -0.8161 0.086 -9.4895 0 to_multiple -2.5651 0.3052 -8.4047 0 winner 1.5801 0.3156 5.0067 0 format -0.1528 0.1136 -1.3451 0.1786 re_subj -2.8401 0.363 -7.824 0 (a) Write down the model using the coefficients from the model fit.log_odds(spam) = -0.8161 + -2.5651 + to_multiple + 1.5801 winner + -0.1528 format + -2.8401 re_subj(b) Suppose we have an observation where to_multiple=0, winner=1, format=0, and re_subj=0. What is the predicted probability that this message is spam?…arrow_forwardConsider an event X comprised of three outcomes whose probabilities are 9/18, 1/18,and 6/18. Compute the probability of the complement of the event. Question content area bottom Part 1 A.1/2 B.2/18 C.16/18 D.16/3arrow_forward
 Holt Mcdougal Larson Pre-algebra: Student Edition...AlgebraISBN:9780547587776Author:HOLT MCDOUGALPublisher:HOLT MCDOUGAL
 Glencoe Algebra 1, Student Edition, 9780079039897...AlgebraISBN:9780079039897Author:CarterPublisher:McGraw Hill
 Big Ideas Math A Bridge To Success Algebra 1: Stu...AlgebraISBN:9781680331141Author:HOUGHTON MIFFLIN HARCOURTPublisher:Houghton Mifflin Harcourt
 College Algebra (MindTap Course List)AlgebraISBN:9781305652231Author:R. David Gustafson, Jeff HughesPublisher:Cengage Learning