Concept explainers
- (a) Give the geometric definition of a parabola.
- (b) Give the equation of a parabola with vertex at the origin and with vertical axis. Where is the focus? What is the directrix?
- (c) Graph the equation x2 = 8y. Indicate the focus on the graph.
(a)
To state: The geometric definition of parabola.
Explanation of Solution
The geometric definition of parabola is stated as follows,
The set of points on a plane which are equidistance from a fixed point and a fixed line is called a parabola. Where the fixed point is called the focus and the fixed line is called the directrix.
(b)
To give: The equation of parabola with vertex at the origin and with vertical axis and find the focus and the directrix.
Answer to Problem 1RCC
The equation of the parabola with vertex at the origin and with vertical axis is
When
When
When
When
Explanation of Solution
Definition used:
“The equation of the parabola with vertex
By the definition stated above the parabola
In case of
In case of
(c)
To graph: The parabola
Answer to Problem 1RCC
The focus and directrix of the parabola
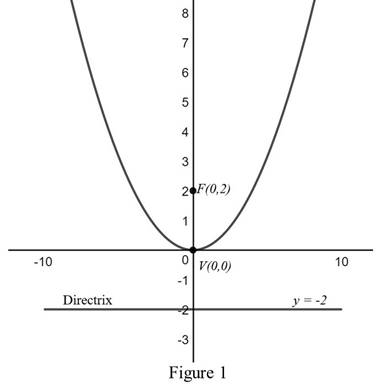
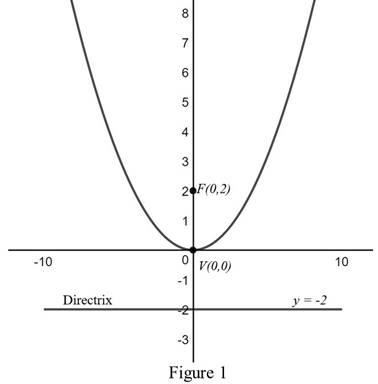
The graph of the parabola

From Figure 1, it is observed that the focus is at
Explanation of Solution
Compare the equation
Therefore, by the definition stated above, focus is
Thus, the focus and directrix of the parabola
The graph of the parabola

From the Figure 1, it is observed that the focus is at
Want to see more full solutions like this?
Chapter 11 Solutions
PRECALCULUS
- Let f(x) = √√x+3 and g(x) = 6x − 2. Find each of the following composite functions and state the domain: (a) fog (b) gof, (c) fof (d) gogarrow_forwardCompute the following: (a) 8x³ + 3x dx (b) cos(2u) du (c) f² ebx dxarrow_forwardFind the following limits. (a) lim 3(x-1)² x→2 x (b) lim 0+x (c) lim 3x2-x+1 x²+3 x²+x-12 x-3 x-3arrow_forward
- For f(x) = (x+3)² - 2 sketch f(x), f(x), f(x − 2), and f(x) — 2. State the coordi- nates of the turning point in each graph.arrow_forwardFor f(x) = (x+3)² - 2 sketch f(x), f(x), f(x − 2), and f(x) — 2. State the coordi- nates of the turning point in each graph.arrow_forward4 For the function f(x) = 4e¯x, find f''(x). Then find f''(0) and f''(1).arrow_forward
- Solve the next ED: (see image)arrow_forwardWrite an equation for the polynomial graphed below. It will probably be easiest to leave your "a" value as a fraction. 8 7 + 9+ H 6 5 4 3 + 3 2 1 (-30) (-1,0) (1,0) (3,0) + -5 -4 -3 -2 2 3 4 7 2 -1 -2 3 (0,-3) f(x) = 456 -4 -5 -6+arrow_forwardWrite an equation for the polynomial graphed below 5+ 4 - 3 2 1 + + -5 4-3 -2 -1 1 2 3 4 5 -1 -2 y(x) = -3 -4 5 -5+ Qarrow_forward
- Write an equation for the polynomial graphed below 6+ 5 + -5 -4 3 y(x) = 4 3 2 1 -1 1 1 -1 -2 -3 -4 -5 2 3 4 5arrow_forwardWrite an equation for the polynomial graphed below 5+ 4 3 1 + + + -5-4-3-2 1 13 4 5 -1 -2 -3 -4 -5+ 4 5 Q y(x) =arrow_forward3. Solve the inequality, and give your answer in interval notation. - (x − 4)³ (x + 1) ≥ 0arrow_forward
 College AlgebraAlgebraISBN:9781305115545Author:James Stewart, Lothar Redlin, Saleem WatsonPublisher:Cengage Learning
 College Algebra (MindTap Course List)AlgebraISBN:9781305652231Author:R. David Gustafson, Jeff HughesPublisher:Cengage Learning
- Algebra & Trigonometry with Analytic GeometryAlgebraISBN:9781133382119Author:SwokowskiPublisher:Cengage


