Concept explainers
Videos
Answers to all problems are at the end of this book. Detailed solutions are available in the Student Solutions Manual, Study Guide, and Problems Book.
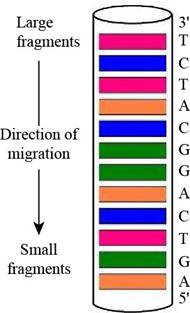
Predicting a Sanger Sequencing Pattern The oligonucleotide d-AGATGCCTGACT as subjected to sequencing by Sanger’s dideoxy method, using fluorescent-tagged dideoxynucleotides and capillary electrophoresis, essentially as shown in Figure 11.3. Draw a diagram of the gel-banding pattern within the capillary.
Interpretation: A diagram of the gel-banding pattern within the capillary is to be drawn.
Concept introduction: A laboratory technique that is used for the separation of charged molecules such as proteins, DNA and RNA on the basis of their size is known as gel electrophoresis. This technique is useful to distinguish DNA fragments of various lengths.
Answer to Problem 1P
A diagram of the gel-banding pattern within the capillary is,
Explanation of Solution
In gel electrophoresis, using dyes such as radioactive labels or fluorescent tags makes it possible to see the DNA on the gel after separation. They are going to appear on the gel as bands. Therefore, the fluorescently labeled dideoxynucleotides result in the formation of the gel banding pattern. The labeled dideoxynucleotides are then added to the growing chain of DNA and capillary electrophoresis is applied to the resulting fragments.
The given oligonucleotide is d-AGATGCCTGACT that was subjected to sequencing by Sanger’s dideoxy method. In gel-banding pattern within the capillary, the top of the column consists of larger fragments and the bottom of the column has smaller fragments. The

Figure 1
Want to see more full solutions like this?
Chapter 11 Solutions
EBK BIOCHEMISTRY


- The following data were recorded for the enzyme catalyzed conversion of S -> P. Question: Estimate the Vmax and Km. What would be the rate at 2.5 and 5.0 x 10⁻⁵ M [S] ?arrow_forwardPlease helparrow_forwardThe following data were recorded for the enzyme catalyzed conversion of S -> P Question: what would the rate be at 5.0 x 10⁻⁵ M [S] and the enzyme concentration was doubled? Also, the rate given in the table is from product accumulation after 10 minuets of reaction time. Verify these rates represent a true initial rate (less than 5% turnover). Please helparrow_forward
- The following data was obtained on isocitrate lyase from an algal species. Identify the reaction catalyzed by this enzyme, deduce the KM and Vmax , and determine the nature of the inhibition by oxaloacetate. Please helparrow_forwardIn the table below, there are sketches of four crystals made of positively-charged cations and negatively-charged anions. Rank these crystals in decreasing order of stability (or equivalently increasing order of energy). That is, select "1" below the most stable (lowest energy) crystal. Select "2" below the next most stable (next lowest energy) crystal, and so forth. A B 鹽 (Choose one) +2 C +2 +2 (Choose one) D 鹽雞 (Choose one) (Choose one)arrow_forward1. Draw the structures for the fats A. 16:2: w-3 and B. 18:3:49,12,15 2. Name each of the molecules below (image attached)arrow_forward
- draw the structures for the fats A. 16:2:w-3 B 18:3:9,12,15arrow_forward1. Below is a template strand of DNA. Show the mRNA and protein that would result. label the ends of the molecules ( refer to attached image)arrow_forwardAttach the followina labels to the diagram below: helicase, single stranded binding proteins, lagging strand, leading strand, DNA polymerase, primase, 5' ends (3), 3' ends (3) (image attached)arrow_forward
- 1. How much energy in terms of ATP can be obtained from tristearin (stearate is 18:0) Show steps pleasearrow_forwardMultiple choice urgent!!arrow_forward1. Write the transamination reaction for alanine. Indicate what happens next to each of the molecules in the reaction, and under what conditions it happens. 2.arrow_forward
 BiochemistryBiochemistryISBN:9781305577206Author:Reginald H. Garrett, Charles M. GrishamPublisher:Cengage Learning