
Concept explainers
Videos
The nonisomorphic graphs of order 1, order 2 and order 3, and explain why the answer is
Answer to Problem 1E
The number nonisomorphic graphs of order 1 is
Explanation of Solution
Definition used:
“Two general graphs
Calculation:
By the definition of the isomorphic graphs, it is observed that the two graphs will have same number of vertices and edges having structural similarities.
Consider the case when order of a simple graph is 1. This graph will have exactly 1 vertex.
The only possible simple graph of order 1 is the graph with one vertex having no edge, which is shown below in Figure 1.
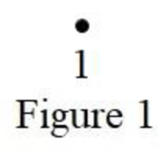
From Figure 1, it is observed that the number of nonisomorphic graphs of order 1 is
Consider the case when order of a simple graph is 2. This graph will have exactly 2 vertex.
The only possible simple graphs of order 2 is the graph with two vertex having no edge as well as one edge, which is shown below in Figure 2.
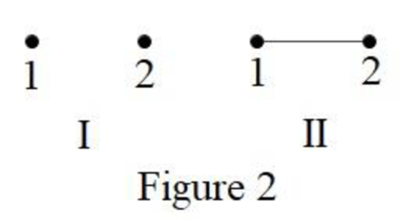
From Figure 2, it is observed that the graphs I and II are nonisomorphic.
Therefore, the number of nonisomorphic graphs of order 2 is
Consider the case when order of a simple graph is 3. This graph will have exactly 3 vertex.
There are 7 possible simple graphs of order 3, which is shown below in Figure 3.
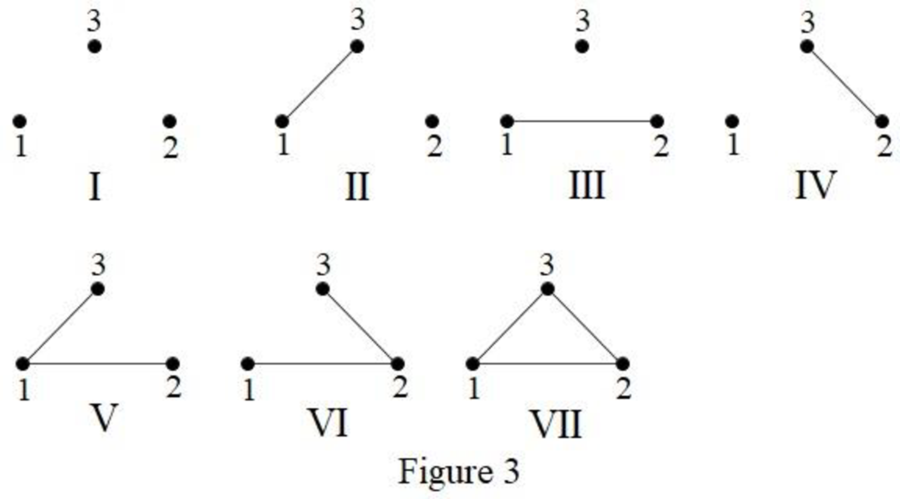
From Figure 3, it is observed that the graphs II, III and IV are isomorphic.
Also, the graphs V and VI are isomorphic.
Thus, the nonisomorphic graphs of order 3 are I, II, V and VII which has the number of edges 0, 1, 2 and 3, respectively.
Therefore, the number nonisomorphic graphs of order 3 is
In the case of general graphs, loops and multi-edges will be present.
That is, for general graphs there is no bound on the number of edges irrespective of the order. Even a single vertex may have many loops.
For example, consider the graph shown below in Figure 4.
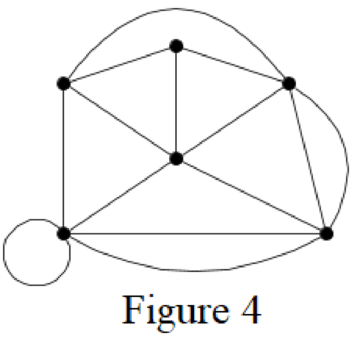
The graph in Figure 4 has multiple edges and loops. There can be many more loops and multiple edges possible in the same graph.
It is known that a graph of order n can have n loops,
Thus, for general graphs, the number of nonisomorphic graphs of order n will be infinite.
Want to see more full solutions like this?
Chapter 11 Solutions
Introductory Combinatorics


- Can you help explain what I did based on partial fractions decomposition?arrow_forwardFind the surface area of the regular pyramid. yd2arrow_forwardSuppose that a particle moves along a straight line with velocity v (t) = 62t, where 0 < t <3 (v(t) in meters per second, t in seconds). Find the displacement d (t) at time t and the displacement up to t = 3. d(t) ds = ["v (s) da = { The displacement up to t = 3 is d(3)- meters.arrow_forward
- Let f (x) = x², a 3, and b = = 4. Answer exactly. a. Find the average value fave of f between a and b. fave b. Find a point c where f (c) = fave. Enter only one of the possible values for c. c=arrow_forwardThe following data represent total ventilation measured in liters of air per minute per square meter of body area for two independent (and randomly chosen) samples. Analyze these data using the appropriate non-parametric hypothesis testarrow_forwardeach column represents before & after measurements on the same individual. Analyze with the appropriate non-parametric hypothesis test for a paired design.arrow_forward
- Should you be confident in applying your regression equation to estimate the heart rate of a python at 35°C? Why or why not?arrow_forwardGiven your fitted regression line, what would be the residual for snake #5 (10 C)?arrow_forwardCalculate the 95% confidence interval around your estimate of r using Fisher’s z-transformation. In your final answer, make sure to back-transform to the original units.arrow_forward
 Discrete Mathematics and Its Applications ( 8th I...MathISBN:9781259676512Author:Kenneth H RosenPublisher:McGraw-Hill Education
 Mathematics for Elementary Teachers with Activiti...MathISBN:9780134392790Author:Beckmann, SybillaPublisher:PEARSON
 Thinking Mathematically (7th Edition)MathISBN:9780134683713Author:Robert F. BlitzerPublisher:PEARSON
 Discrete Mathematics With ApplicationsMathISBN:9781337694193Author:EPP, Susanna S.Publisher:Cengage Learning,
 Pathways To Math Literacy (looseleaf)MathISBN:9781259985607Author:David Sobecki Professor, Brian A. MercerPublisher:McGraw-Hill Education