For the following exercises, (a) determine the domain and the range of each relation, and (b) state whether the relation is a function.
1.
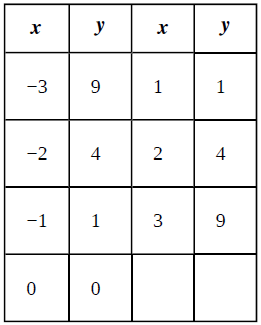
| x | y | x | y |
| -3 | 9 | 1 | 1 |
| 2 | 4 | 2 | 4 |
| -1 | 1 | 3 | 9 |
| 0 | 0 |
a.
The domain and the range of given relation
Answer to Problem 1E
The domain is
Explanation of Solution
Given:
We are given with a Table as below:

Concept Used:
A relation is defined as the set of ordered pairs. A function consists of three important parts, the input values, the output values and a rule or a set of rules which defines the relation between input and output.
Here the set of input is known as Domain whereas the set of output is known as the Range.
Calculation:
Using the concept that a relation is defined as the set of ordered pairs and a function consists of three important parts, the input values, the output values and a rule or a set of rules which defines the relation between input and output. Here the set of input is known as Domain whereas the set of output is known as the Range.
So we can say the Domain is
The range of the relation is
Conclusion:
The domain and the range of given relation is
b.
State whether the relation is a function.
Answer to Problem 1E
The given relation is a function.
Explanation of Solution
Given:
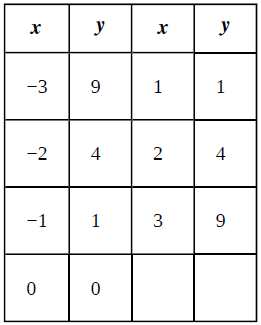
We are given with a Table as below:

Concept Used:
A function relates every elements of domain to exactly one element in the range.
Calculation:
Using the concept-A function relates every elements of domain to exactly one element in the range.
We can observe from the given table that every elements of domain relates to exactly one element in the range.
Hence the given relation is a function.
Conclusion:
The given relation is a function.
Want to see more full solutions like this?
Chapter 1 Solutions
Calculus Volume 1
Additional Math Textbook Solutions
Calculus: Early Transcendentals (2nd Edition)
Using and Understanding Mathematics: A Quantitative Reasoning Approach (6th Edition)
A First Course in Probability (10th Edition)
University Calculus: Early Transcendentals (4th Edition)
Elementary Statistics (13th Edition)
- Suppose that one factory inputs its goods from two different plants, A and B, with different costs, 3 and 7 each respective. And suppose the price function in the market is decided as p(x, y) = 100 - x - y where x and y are the demand functions and 0 < x, y. Then as x = y= the factory can attain the maximum profit,arrow_forwardBob and Teresa each collect their own samples to test the same hypothesis. Bob’s p-value turns out to be 0.05, and Teresa’s turns out to be 0.01. Why don’t Bob and Teresa get the same p-values? Who has stronger evidence against the null hypothesis: Bob or Teresa?arrow_forwardf(x) = = x - 3 x²-9 f(x) = {x + 1 x > 3 4 x < 3 -10 5 10 5 5. 10 5- 07. 10 -10 -5 0 10 5 -101 :: The function has a “step" or "jump" discontinuity at x = 3 where f(3) = 7. :: The function has a value of f (3), a limit as x approaches 3, but is not continuous at x = 3. :: The function has a limit as x approaches 3, but the function is not defined and is not continuous at x = 3. :: The function has a removable discontinuity at x=3 and an infinite discontinuity at x= -3.arrow_forward
- Review a classmate's Main Post. 1. State if you agree or disagree with the choices made for additional analysis that can be done beyond the frequency table. 2. Choose a measure of central tendency (mean, median, mode) that you would like to compute with the data beyond the frequency table. Complete either a or b below. a. Explain how that analysis can help you understand the data better. b. If you are currently unable to do that analysis, what do you think you could do to make it possible? If you do not think you can do anything, explain why it is not possible.arrow_forwardCalculus lll May I please have the solutions for the following examples? Thank youarrow_forwardCalculus lll May I please have the solutions for the following exercises that are blank? Thank youarrow_forward
- The graph of 2(x² + y²)² = 25 (x²-y²), shown in the figure, is a lemniscate of Bernoulli. Find the equation of the tangent line at the point (3,1). -10 Write the expression for the slope in terms of x and y. slope = 4x³ + 4xy2-25x 2 3 4x²y + 4y³ + 25y Write the equation for the line tangent to the point (3,1). LV Q +arrow_forwardFind the equation of the tangent line at the given value of x on the curve. 2y3+xy-y= 250x4; x=1 y=arrow_forwardFind the equation of the tangent line at the given point on the curve. 3y² -√x=44, (16,4) y=] ...arrow_forward
- For a certain product, cost C and revenue R are given as follows, where x is the number of units sold in hundreds. Cost: C² = x² +92√x+56 Revenue: 898(x-6)² + 24R² = 16,224 dC a. Find the marginal cost at x = 6. dx The marginal cost is estimated to be $ ☐ . (Do not round until the final answer. Then round to the nearest hundredth as needed.)arrow_forwardfind the area.arrow_forwardThe graph of 3 (x² + y²)² = 100 (x² - y²), shown in the figure, is a lemniscate of Bernoulli. Find the equation of the tangent line at the point (4,2). АУ -10 10 Write the expression for the slope in terms of x and y. slope =arrow_forward

 Holt Mcdougal Larson Pre-algebra: Student Edition...AlgebraISBN:9780547587776Author:HOLT MCDOUGALPublisher:HOLT MCDOUGAL
 Glencoe Algebra 1, Student Edition, 9780079039897...AlgebraISBN:9780079039897Author:CarterPublisher:McGraw Hill
 Algebra: Structure And Method, Book 1AlgebraISBN:9780395977224Author:Richard G. Brown, Mary P. Dolciani, Robert H. Sorgenfrey, William L. ColePublisher:McDougal Littell


