
Essentials of Statistics for the Behavioral Sciences
8th Edition
ISBN: 9781133956570
Author: Frederick J Gravetter, Larry B. Wallnau
Publisher: Cengage Learning
expand_more
expand_more
format_list_bulleted
Videos
Textbook Question
Chapter 11, Problem 19P
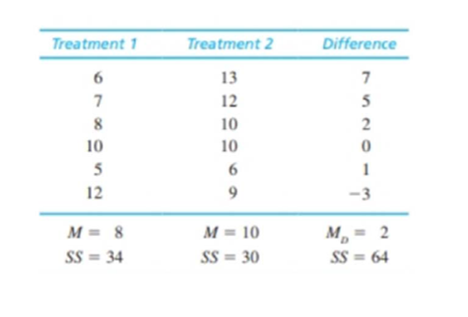
Problem 18 shows that removing individual differences can substantially reduce variance and lower the standard error. However, this benefit only occurs if the individual differences are consistent across treatment conditions. In problem 18, for example, the first two participants (top two rows) consistently had the highest scores in both treatment conditions. Similarly, the last two participants consistently had the lowest scores in both treatments. To construct the following data, we started with the scores in problem 18 and scrambled the scores in treatment 1 to eliminate the consistency of the individual differences.
- a. Assume that the data are from an independent-measures study using two separate samples, each with n = 6 participants. Compute the pooled variance and the estimated standard error for the
mean difference. - b. Now assume that the data are from a repeated measures study using the same sample of n = 6 participants in both treatment conditions. Compute the variance for the sample of difference scores and the estimated standard error for the mean difference. (This time you should find that removing the individual differences does not reduce the variance or the standard error.)
Expert Solution & Answer
Want to see the full answer?
Check out a sample textbook solution
Students have asked these similar questions
Suppose an experiment was conducted to compare the mileage(km) per litre
obtained by competing brands of petrol I,II,III. Three new Mazda, three new
Toyota and three new Nissan cars were available for experimentation. During the
experiment the cars would operate under same conditions in order to eliminate
the effect of external variables on the distance travelled per litre on the assigned
brand of petrol. The data is given as below:
Brands of Petrol Mazda Toyota Nissan
I 10.6 12.0 11.0
II 9.0 15.0 12.0
III 12.0 17.4 13.0
(a) Test at the 5% level of significance whether there are signi
cant differences among the brands of fuels and also among the cars. [10]
(b) Compute the standard error for comparing any two fuel brands means. Hence
compare, at the 5% level of significance, each of fuel brands II, and III with
the standard fuel brand I. [10] �
Business discuss
What would you say about a set of quantitative bivariate data whose linear correlation is -1? What would a scatter diagram of the data look like? (5 points)
Chapter 11 Solutions
Essentials of Statistics for the Behavioral Sciences
Ch. 11.2 - For the following data from a repeated-measures...Ch. 11.2 - Prob. 2LCCh. 11.3 - Prob. 1LCCh. 11.3 - A researcher is investigating the effectiveness of...Ch. 11.3 - Prob. 2LCACh. 11.3 - Prob. 3LCACh. 11.4 - Prob. 1LCCh. 11.4 - Prob. 2LCCh. 11.4 - Prob. 3LCCh. 11 - What is the defining characteristic of a...
Ch. 11 - Participants enter a research study with unique...Ch. 11 - Explain the difference between a matched-subjects...Ch. 11 - A researcher conducts an experiment comparing two...Ch. 11 - A sample of n = 9 individuals participates in a...Ch. 11 - Solve the following problems. a. A...Ch. 11 - Prob. 7PCh. 11 - A sample of difference scores from a...Ch. 11 - When you get a surprisingly low price on a product...Ch. 11 - Research has shown that losing even one night's...Ch. 11 - Prob. 11PCh. 11 - Masculine-themed words (such us competitive,...Ch. 11 - Research results indicate that physically...Ch. 11 - Researchers have noted a decline in cognitive...Ch. 11 - The following data are from a repeated-measures...Ch. 11 - A researcher for a cereal company wanted to...Ch. 11 - Research indicates that the color red increases...Ch. 11 - One of the primary advantages of a...Ch. 11 - Problem 18 shows that removing individual...Ch. 11 - A researcher uses a matched-subjects design to...Ch. 11 - Some evidence suggests that you are likely to...Ch. 11 - The teacher from Problem 21 also tried a different...Ch. 11 - At the Olympic level of competition, even the...Ch. 11 - Example 11.1 in this chapter presented a...Ch. 11 - Belsky, Weinraub, Owen, and Kelly (2001) reported...Ch. 11 - Do you view a chocolate bar as delicious or as...Ch. 11 - Prob. 3RE
Knowledge Booster


Learn more about
Need a deep-dive on the concept behind this application? Look no further. Learn more about this topic, statistics and related others by exploring similar questions and additional content below.Similar questions
- Business discussarrow_forwardAnalyze the residuals of a linear regression model and select the best response. yes, the residual plot does not show a curve no, the residual plot shows a curve yes, the residual plot shows a curve no, the residual plot does not show a curve I answered, "No, the residual plot shows a curve." (and this was incorrect). I am not sure why I keep getting these wrong when the answer seems obvious. Please help me understand what the yes and no references in the answer.arrow_forwarda. Find the value of A.b. Find pX(x) and py(y).c. Find pX|y(x|y) and py|X(y|x)d. Are x and y independent? Why or why not?arrow_forward
- Analyze the residuals of a linear regression model and select the best response.Criteria is simple evaluation of possible indications of an exponential model vs. linear model) no, the residual plot does not show a curve yes, the residual plot does not show a curve yes, the residual plot shows a curve no, the residual plot shows a curve I selected: yes, the residual plot shows a curve and it is INCORRECT. Can u help me understand why?arrow_forwardYou have been hired as an intern to run analyses on the data and report the results back to Sarah; the five questions that Sarah needs you to address are given below. please do it step by step on excel Does there appear to be a positive or negative relationship between price and screen size? Use a scatter plot to examine the relationship. Determine and interpret the correlation coefficient between the two variables. In your interpretation, discuss the direction of the relationship (positive, negative, or zero relationship). Also discuss the strength of the relationship. Estimate the relationship between screen size and price using a simple linear regression model and interpret the estimated coefficients. (In your interpretation, tell the dollar amount by which price will change for each unit of increase in screen size). Include the manufacturer dummy variable (Samsung=1, 0 otherwise) and estimate the relationship between screen size, price and manufacturer dummy as a multiple…arrow_forwardHere is data with as the response variable. x y54.4 19.124.9 99.334.5 9.476.6 0.359.4 4.554.4 0.139.2 56.354 15.773.8 9-156.1 319.2Make a scatter plot of this data. Which point is an outlier? Enter as an ordered pair, e.g., (x,y). (x,y)= Find the regression equation for the data set without the outlier. Enter the equation of the form mx+b rounded to three decimal places. y_wo= Find the regression equation for the data set with the outlier. Enter the equation of the form mx+b rounded to three decimal places. y_w=arrow_forward
- You have been hired as an intern to run analyses on the data and report the results back to Sarah; the five questions that Sarah needs you to address are given below. please do it step by step Does there appear to be a positive or negative relationship between price and screen size? Use a scatter plot to examine the relationship. Determine and interpret the correlation coefficient between the two variables. In your interpretation, discuss the direction of the relationship (positive, negative, or zero relationship). Also discuss the strength of the relationship. Estimate the relationship between screen size and price using a simple linear regression model and interpret the estimated coefficients. (In your interpretation, tell the dollar amount by which price will change for each unit of increase in screen size). Include the manufacturer dummy variable (Samsung=1, 0 otherwise) and estimate the relationship between screen size, price and manufacturer dummy as a multiple linear…arrow_forwardExercises: Find all the whole number solutions of the congruence equation. 1. 3x 8 mod 11 2. 2x+3= 8 mod 12 3. 3x+12= 7 mod 10 4. 4x+6= 5 mod 8 5. 5x+3= 8 mod 12arrow_forwardScenario Sales of products by color follow a peculiar, but predictable, pattern that determines how many units will sell in any given year. This pattern is shown below Product Color 1995 1996 1997 Red 28 42 21 1998 23 1999 29 2000 2001 2002 Unit Sales 2003 2004 15 8 4 2 1 2005 2006 discontinued Green 26 39 20 22 28 14 7 4 2 White 43 65 33 36 45 23 12 Brown 58 87 44 48 60 Yellow 37 56 28 31 Black 28 42 21 Orange 19 29 Purple Total 28 42 21 49 68 78 95 123 176 181 164 127 24 179 Questions A) Which color will sell the most units in 2007? B) Which color will sell the most units combined in the 2007 to 2009 period? Please show all your analysis, leave formulas in cells, and specify any assumptions you make.arrow_forward
- One hundred students were surveyed about their preference between dogs and cats. The following two-way table displays data for the sample of students who responded to the survey. Preference Male Female TOTAL Prefers dogs \[36\] \[20\] \[56\] Prefers cats \[10\] \[26\] \[36\] No preference \[2\] \[6\] \[8\] TOTAL \[48\] \[52\] \[100\] problem 1 Find the probability that a randomly selected student prefers dogs.Enter your answer as a fraction or decimal. \[P\left(\text{prefers dogs}\right)=\] Incorrect Check Hide explanation Preference Male Female TOTAL Prefers dogs \[\blueD{36}\] \[\blueD{20}\] \[\blueE{56}\] Prefers cats \[10\] \[26\] \[36\] No preference \[2\] \[6\] \[8\] TOTAL \[48\] \[52\] \[100\] There were \[\blueE{56}\] students in the sample who preferred dogs out of \[100\] total students.arrow_forwardBusiness discussarrow_forwardYou have been hired as an intern to run analyses on the data and report the results back to Sarah; the five questions that Sarah needs you to address are given below. Does there appear to be a positive or negative relationship between price and screen size? Use a scatter plot to examine the relationship. Determine and interpret the correlation coefficient between the two variables. In your interpretation, discuss the direction of the relationship (positive, negative, or zero relationship). Also discuss the strength of the relationship. Estimate the relationship between screen size and price using a simple linear regression model and interpret the estimated coefficients. (In your interpretation, tell the dollar amount by which price will change for each unit of increase in screen size). Include the manufacturer dummy variable (Samsung=1, 0 otherwise) and estimate the relationship between screen size, price and manufacturer dummy as a multiple linear regression model. Interpret the…arrow_forward
arrow_back_ios
SEE MORE QUESTIONS
arrow_forward_ios
Recommended textbooks for you
 Linear Algebra: A Modern IntroductionAlgebraISBN:9781285463247Author:David PoolePublisher:Cengage Learning
 Functions and Change: A Modeling Approach to Coll...AlgebraISBN:9781337111348Author:Bruce Crauder, Benny Evans, Alan NoellPublisher:Cengage Learning
 Big Ideas Math A Bridge To Success Algebra 1: Stu...AlgebraISBN:9781680331141Author:HOUGHTON MIFFLIN HARCOURTPublisher:Houghton Mifflin Harcourt
Linear Algebra: A Modern Introduction
Algebra
ISBN:9781285463247
Author:David Poole
Publisher:Cengage Learning
Functions and Change: A Modeling Approach to Coll...
Algebra
ISBN:9781337111348
Author:Bruce Crauder, Benny Evans, Alan Noell
Publisher:Cengage Learning
Big Ideas Math A Bridge To Success Algebra 1: Stu...
Algebra
ISBN:9781680331141
Author:HOUGHTON MIFFLIN HARCOURT
Publisher:Houghton Mifflin Harcourt
Introduction to experimental design and analysis of variance (ANOVA); Author: Dr. Bharatendra Rai;https://www.youtube.com/watch?v=vSFo1MwLoxU;License: Standard YouTube License, CC-BY