
Concept explainers
Videos
For Exercises 1 through 10, follow these steps.
a. State the hypotheses and identify the claim.
b. Find the critical value(s).
c. Compute the test value.
d. Make the decision.
e. Summarize the results.
Use the traditional method of hypothesis testing unless otherwise specified. Assume all assumptions have been met.
1. Traffic Accident Fatalities A traffic safety report indicated that for the 21–24 year age group, 31.58% of traffic fatalities were victims who had used a seat belt. Victims who were not wearing a seat belt accounted for 59.83% of the deaths, and the status of the rest was unknown. A study of 120 randomly selected traffic fatalities in a particular region showed that for this age group, 35 of the victims had used a seat belt, 78 had not, and the status of the rest was unknown. At α = 0.05, is there sufficient evidence that the proportions differ from those in the report?
Source: New York Times Almanac.
(a)
To state: The hypothesis and the claim.
Answer to Problem 11.1.1RE
The null and alternative hypotheses are:
And the claim of the test is the observed proportion is different from the reported proportion.
Explanation of Solution
Given info:
The percentage of death and the observed count corresponding to each reason are provided in the question. The level of significance is
Justification:
The researcher wants to know that whether the proportion of the traffic fatalities corresponding to each reason is different from the reported proportion or not. The null and alternative hypothesis can be defined as:
Null hypothesis:
Alternative hypothesis:
In the provided situation, the claim of the study will be the observed proportion corresponding to each reason is different from the reported proportion.
(b)
The critical value.
Answer to Problem 11.1.1RE
The required critical value is 5.991.
Explanation of Solution
The required critical value is obtained from the provided chi-square table in the textbook. The number of categories is 3.
The degrees of freedom is calculated as:
Therefore, the critical value at
(c)
The value of the test statistic.
Answer to Problem 11.1.1RE
The test statistic value is 1.819.
Explanation of Solution
Calculation:
Software procedure:
Step-by-step procedure to obtain the test statistic using the MINITAB software:
- Enter the data in the Minitab worksheet.
- Go to Stat> Tables> Chi-Square Goodness-of-Fit Test (one variable).
- Specify the “Observed count”, choose the option “Proportions specified by historic count”, and specify the column where the percentage is written.
- Click on OK.
Output using the MINITAB software is given below:
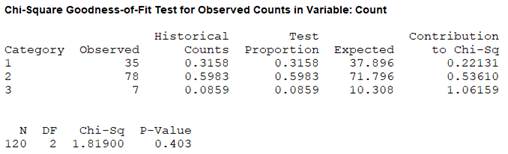
Therefore, the obtained value of the test statistic is 1.819.
(d)
To make: The decision.
Answer to Problem 11.1.1RE
The null hypothesis will not be rejected.
Explanation of Solution
The obtained value of the test statistic is 1.819 and the critical value is 5.991. As the obtained value of the chi-square statistic is less than the critical value, it can be said that there is not enough evidence to reject the null hypothesis at
(e)
To summarize: The results.
Answer to Problem 11.1.1RE
According to the obtained result, the claim of the study is not true.
Explanation of Solution
The null hypothesis is not rejected. On the basis of the obtained result, it can be concluded that the result of the proportion of the traffic fatalities is not different from the reported proportion at
Want to see more full solutions like this?
Chapter 11 Solutions
Elementary Statistics: A Step By Step Approach


- 1. [20] The joint PDF of RVs X and Y is given by xe-(z+y), r>0, y > 0, fx,y(x, y) = 0, otherwise. (a) Find P(0X≤1, 1arrow_forward4. [20] Let {X1,..., X} be a random sample from a continuous distribution with PDF f(x; 0) = { Axe 5 0, x > 0, otherwise. where > 0 is an unknown parameter. Let {x1,...,xn} be an observed sample. (a) Find the value of c in the PDF. (b) Find the likelihood function of 0. (c) Find the MLE, Ô, of 0. (d) Find the bias and MSE of 0.arrow_forward3. [20] Let {X1,..., Xn} be a random sample from a binomial distribution Bin(30, p), where p (0, 1) is unknown. Let {x1,...,xn} be an observed sample. (a) Find the likelihood function of p. (b) Find the MLE, p, of p. (c) Find the bias and MSE of p.arrow_forwardGiven the sample space: ΩΞ = {a,b,c,d,e,f} and events: {a,b,e,f} A = {a, b, c, d}, B = {c, d, e, f}, and C = {a, b, e, f} For parts a-c: determine the outcomes in each of the provided sets. Use proper set notation. a. (ACB) C (AN (BUC) C) U (AN (BUC)) AC UBC UCC b. C. d. If the outcomes in 2 are equally likely, calculate P(AN BNC).arrow_forwardSuppose a sample of O-rings was obtained and the wall thickness (in inches) of each was recorded. Use a normal probability plot to assess whether the sample data could have come from a population that is normally distributed. Click here to view the table of critical values for normal probability plots. Click here to view page 1 of the standard normal distribution table. Click here to view page 2 of the standard normal distribution table. 0.191 0.186 0.201 0.2005 0.203 0.210 0.234 0.248 0.260 0.273 0.281 0.290 0.305 0.310 0.308 0.311 Using the correlation coefficient of the normal probability plot, is it reasonable to conclude that the population is normally distributed? Select the correct choice below and fill in the answer boxes within your choice. (Round to three decimal places as needed.) ○ A. Yes. The correlation between the expected z-scores and the observed data, , exceeds the critical value, . Therefore, it is reasonable to conclude that the data come from a normal population. ○…arrow_forwardding question ypothesis at a=0.01 and at a = 37. Consider the following hypotheses: 20 Ho: μ=12 HA: μ12 Find the p-value for this hypothesis test based on the following sample information. a. x=11; s= 3.2; n = 36 b. x = 13; s=3.2; n = 36 C. c. d. x = 11; s= 2.8; n=36 x = 11; s= 2.8; n = 49arrow_forward13. A pharmaceutical company has developed a new drug for depression. There is a concern, however, that the drug also raises the blood pressure of its users. A researcher wants to conduct a test to validate this claim. Would the manager of the pharmaceutical company be more concerned about a Type I error or a Type II error? Explain.arrow_forwardFind the z score that corresponds to the given area 30% below z.arrow_forwardFind the following probability P(z<-.24)arrow_forward3. Explain why the following statements are not correct. a. "With my methodological approach, I can reduce the Type I error with the given sample information without changing the Type II error." b. "I have already decided how much of the Type I error I am going to allow. A bigger sample will not change either the Type I or Type II error." C. "I can reduce the Type II error by making it difficult to reject the null hypothesis." d. "By making it easy to reject the null hypothesis, I am reducing the Type I error."arrow_forwardGiven the following sample data values: 7, 12, 15, 9, 15, 13, 12, 10, 18,12 Find the following: a) Σ x= b) x² = c) x = n d) Median = e) Midrange x = (Enter a whole number) (Enter a whole number) (use one decimal place accuracy) (use one decimal place accuracy) (use one decimal place accuracy) f) the range= g) the variance, s² (Enter a whole number) f) Standard Deviation, s = (use one decimal place accuracy) Use the formula s² ·Σx² -(x)² n(n-1) nΣ x²-(x)² 2 Use the formula s = n(n-1) (use one decimal place accuracy)arrow_forwardTable of hours of television watched per week: 11 15 24 34 36 22 20 30 12 32 24 36 42 36 42 26 37 39 48 35 26 29 27 81276 40 54 47 KARKE 31 35 42 75 35 46 36 42 65 28 54 65 28 23 28 23669 34 43 35 36 16 19 19 28212 Using the data above, construct a frequency table according the following classes: Number of Hours Frequency Relative Frequency 10-19 20-29 |30-39 40-49 50-59 60-69 70-79 80-89 From the frequency table above, find a) the lower class limits b) the upper class limits c) the class width d) the class boundaries Statistics 300 Frequency Tables and Pictures of Data, page 2 Using your frequency table, construct a frequency and a relative frequency histogram labeling both axes.arrow_forwardarrow_back_iosSEE MORE QUESTIONSarrow_forward_ios
 Glencoe Algebra 1, Student Edition, 9780079039897...AlgebraISBN:9780079039897Author:CarterPublisher:McGraw Hill
 College Algebra (MindTap Course List)AlgebraISBN:9781305652231Author:R. David Gustafson, Jeff HughesPublisher:Cengage Learning
 Holt Mcdougal Larson Pre-algebra: Student Edition...AlgebraISBN:9780547587776Author:HOLT MCDOUGALPublisher:HOLT MCDOUGAL