Videos
On the show How I Met Your Mother, Marshall demonstrated the true versatility of pie charts and bar graphs in the most brilliant way possible: by making a pie chart describing his favorite bars, and a bar graph describing his favorite pies. The charts are reproduced below.
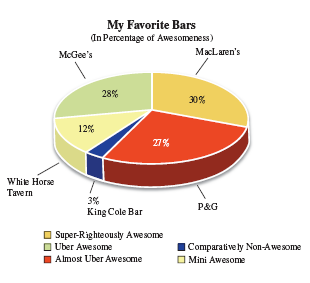
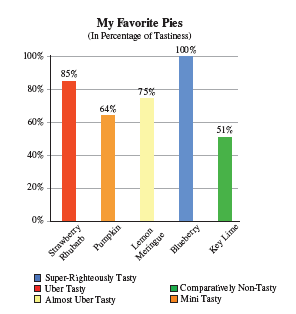
What does your answer to Question 9 tell you about pie charts drawn in a three-dimensional format? Explain.
Want to see the full answer?
Check out a sample textbook solution
Chapter 1 Solutions
Connect Math Hosted By Aleks Access Card For Pathways To Math Literacy
Additional Math Textbook Solutions
Finite Mathematics for Business, Economics, Life Sciences and Social Sciences
Precalculus: Mathematics for Calculus (Standalone Book)
Pathways To Math Literacy (looseleaf)
Precalculus: A Unit Circle Approach (3rd Edition)
Elementary & Intermediate Algebra
Elementary and Intermediate Algebra: Concepts and Applications (7th Edition)


- Prove that (1) Σσς (α) μ(η/α) = n d/n (ii) Σσς(d) = η Σσο(α)/d d❘n d❘n (iii) σ (d) σ (n/d) = Σ d³oo(d) σo(n/d). d|n dnarrow_forwardII Consider the following data matrix X: X1 X2 0.5 0.4 0.2 0.5 0.5 0.5 10.3 10 10.1 10.4 10.1 10.5 What will the resulting clusters be when using the k-Means method with k = 2. In your own words, explain why this result is indeed expected, i.e. why this clustering minimises the ESS map.arrow_forwardX Acellus | Student admin192c.acellus.com go 0:0 Hannah wants to have concrete stairs for her backdoor. How much concrete will be needed to build the stairs? 20 cm 70 cm 30 cm 15 cm 10 cm 45 cm cm 70 cm GIF 自 لاarrow_forward
- why the answer is 3 and 10?arrow_forward1 Hannah wants to have concrete stairs for her backdoor. How much concrete will be needed to build the stairs? 70 cm 30 cm 15 cm 10 cm 10 cm 20 cm 45 cm cm³ GIF GIF/ 2 3 4 qwe asdf 5 6 自 yu ty u 8 ghjk 9 P Z X C cv b vbnm ×arrow_forwardPS 9 Two films are shown on screen A and screen B at a cinema each evening. The numbers of people viewing the films on 12 consecutive evenings are shown in the back-to-back stem-and-leaf diagram. Screen A (12) Screen B (12) 8 037 34 7 6 4 0 534 74 1645678 92 71689 Key: 116|4 represents 61 viewers for A and 64 viewers for B A second stem-and-leaf diagram (with rows of the same width as the previous diagram) is drawn showing the total number of people viewing films at the cinema on each of these 12 evenings. Find the least and greatest possible number of rows that this second diagram could have. TIP On the evening when 30 people viewed films on screen A, there could have been as few as 37 or as many as 79 people viewing films on screen B.arrow_forward
 Glencoe Algebra 1, Student Edition, 9780079039897...AlgebraISBN:9780079039897Author:CarterPublisher:McGraw Hill
 Algebra: Structure And Method, Book 1AlgebraISBN:9780395977224Author:Richard G. Brown, Mary P. Dolciani, Robert H. Sorgenfrey, William L. ColePublisher:McDougal Littell
 Algebra & Trigonometry with Analytic GeometryAlgebraISBN:9781133382119Author:SwokowskiPublisher:Cengage
 College Algebra (MindTap Course List)AlgebraISBN:9781305652231Author:R. David Gustafson, Jeff HughesPublisher:Cengage Learning