A Problem Solving Approach to Mathematics for Elementary School Teachers (12th Edition)
12th Edition
ISBN: 9780321987297
Author: Rick Billstein, Shlomo Libeskind, Johnny Lott
Publisher: PEARSON
expand_more
expand_more
format_list_bulleted
Concept explainers
Videos
Textbook Question
Chapter 10.2A, Problem 1A
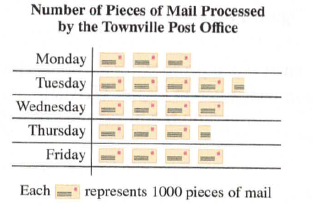
The following the pictograph shows the approximate number of pieces of mail processes at the Townville post office over a five-day week.
a. On what day were the most pieces processed?
b. About how many more pieces of mail were processed in Tuesday than on Monday?
c. How many symbols would be used to represents
Expert Solution & Answer
Want to see the full answer?
Check out a sample textbook solution
Students have asked these similar questions
can I see the steps for how you got the same answers already provided for μ1->μ4. this is a homework that provide you answers for question after attempting it three tries
1. Prove that for each n in N, 1+2++ n = n(n+1)/2.
2. Prove that for each n in N, 13 +23+
3. Prove that for each n in N, 1+3+5+1
4. Prove that for each n ≥ 4,2" -1, then (1+x)" ≥1+nx for each
n in N.
11. Prove DeMoivre's Theorem: fort a real number,
(cost+i sint)" = cos nt + i sinnt
for each n in N, where i = √√-1.
Given the following sample data values:
7, 12, 15, 9, 15, 13, 12, 10, 18,12
Find the following:
a) Σ
x=
b) x² =
c) x =
n
d) Median
=
e) Midrange
x
=
(Enter a whole number)
(Enter a whole number)
(use one decimal place accuracy)
(use one decimal place accuracy)
(use one decimal place accuracy)
f) the range=
g) the variance, s²
(Enter a whole number)
f) Standard Deviation, s =
(use one decimal place accuracy)
Use the formula s²
·Σx² -(x)²
n(n-1)
nΣ x²-(x)²
2
Use the formula s =
n(n-1)
(use one decimal place accuracy)
Chapter 10 Solutions
A Problem Solving Approach to Mathematics for Elementary School Teachers (12th Edition)
Ch. 10.1 - Read about basic ideas of statistics in Common...Ch. 10.1 - Suggest how students at different grades might...Ch. 10.1 - Examine grade-school books to see what types of...Ch. 10.1 - Mathematical Connections What are the Nielsen...Ch. 10.1 - Prob. 7MCCh. 10.1 - National Assessment of Educational ProgressNAEP...Ch. 10.1 - Prob. 2NAEPCh. 10.1A - A second-grade class has a project to determine...Ch. 10.1A - Prob. 2ACh. 10.1A - Prob. 3A
Ch. 10.1A - To determine the most popular book among students...Ch. 10.1A - Prob. 5ACh. 10.1A - Prob. 6ACh. 10.1A - If a class were to investigate how many countries...Ch. 10.1A - Prob. 8ACh. 10.1A - In a set of student evaluations of their...Ch. 10.1A - Prob. 10ACh. 10.1A - If a bar graph like the one shown here were used...Ch. 10.1A - Prob. 12ACh. 10.1B - A second-grade class has a project to determine...Ch. 10.1B - An elementary school class decides to determine...Ch. 10.1B - Assessment To determine student computer use,...Ch. 10.1B - Prob. 7ACh. 10.1B - Prob. 8ACh. 10.1B - Assessment A university professor used a rating...Ch. 10.1B - Suppose a poll is to be conducted in an elementary...Ch. 10.1B - Prob. 11ACh. 10.1B - Determine the population and the sample in the...Ch. 10.2 - Mathematical Connections a. Discuss when a...Ch. 10.2 - Mathematical Connections Explain whether a circle...Ch. 10.2 - Mathematical Connections Explain why the sum of...Ch. 10.2 - Mathematical Connections The federal budget for...Ch. 10.2 - Prob. 5MCCh. 10.2 - Prob. 6MCCh. 10.2 - Mathematical Connections Find five examples of...Ch. 10.2 - Mathematical Connections A graph similar to the...Ch. 10.2 - Prob. 11MCCh. 10.2 - Prob. 12MCCh. 10.2 - Prob. 13MCCh. 10.2 - Prob. 14MCCh. 10.2 - Mathematical Connections Paul asks how to create a...Ch. 10.2 - National Assessment of Educational Progress NAEP...Ch. 10.2 - Prob. 2NAEPCh. 10.2 - National Assessment of Educational Progress NAEP...Ch. 10.2A - The following the pictograph shows the approximate...Ch. 10.2A - Prob. 2ACh. 10.2A - Sixth grade students reported the numbers of apps...Ch. 10.2A - Prob. 4ACh. 10.2A - Draw a histogram based on the stem and leaf plot...Ch. 10.2A - Prob. 6ACh. 10.2A - Prob. 7ACh. 10.2A - Prob. 8ACh. 10.2A - Prob. 9ACh. 10.2A - Prob. 10ACh. 10.2A - Seniors Sierra High were asked to about their...Ch. 10.2A - Prob. 12ACh. 10.2A - a. A 2-inch-long rectangle serves as a percentage...Ch. 10.2A - Prob. 14ACh. 10.2A - a. If the number of people reading mysteries in...Ch. 10.2A - Prob. 16ACh. 10.2A - Prob. 17ACh. 10.2A - Prob. 18ACh. 10.2A - Prob. 19ACh. 10.2B - The following pictograph shows the approximate...Ch. 10.2B - Display the following information about the status...Ch. 10.2B - Prob. 3ACh. 10.2B - The heights reached by 15 model rockets launched...Ch. 10.2B - Prob. 5ACh. 10.2B - Prob. 6ACh. 10.2B - Given the following bar graph, estimate the length...Ch. 10.2B - Prob. 8ACh. 10.2B - Prob. 9ACh. 10.2B - Prob. 10ACh. 10.2B - Draw a circle graph for the data in exercise 10....Ch. 10.2B - Use the circle graph to answer the following...Ch. 10.2B - a. In a circle graph, a sector containing 82...Ch. 10.2B - Prob. 14ACh. 10.2B - A list of presidents, with the number of children...Ch. 10.2B - Prob. 16ACh. 10.2B - The histogram below shows the number of books read...Ch. 10.3 - Explain the concept of association as it is...Ch. 10.3 - Jacquie argued that scatterplots had little value...Ch. 10.3 - The Smith family drew a circle graph of their...Ch. 10.3 - Prob. 9MCCh. 10.3 - Prob. 10MCCh. 10.3 - Prob. 1NAEPCh. 10.3A - Assessment The graph below shows the population of...Ch. 10.3A - Prob. 3ACh. 10.3A - Prob. 4ACh. 10.3A - Prob. 5ACh. 10.3A - Prob. 6ACh. 10.3A - Assessment Consider an arithmetic sequence with...Ch. 10.3A - Prob. 8ACh. 10.3A - Assessment In the following scatterplots, find an...Ch. 10.3A - The following data show the cost of various...Ch. 10.3A - Assessment If a trend line has equation...Ch. 10.3A - Assessment If a trend line has equation y=150.8x,...Ch. 10.3B - The graph below shows the average age at which...Ch. 10.3B - Answer the following questions based on the line...Ch. 10.3B - The graph below shows line graphs for...Ch. 10.3B - The graph depicts the spelling result from Mr....Ch. 10.3B - Prob. 5ACh. 10.3B - Prob. 6ACh. 10.3B - Prob. 7ACh. 10.3B - Use the scatterplots shown to answer the...Ch. 10.3B - In the following scatterplots, find an equation of...Ch. 10.3B - Prob. 10ACh. 10.3B - Prob. 11ACh. 10.3B - Prob. 12ACh. 10.3B - Assessment If a trend line has equation...Ch. 10.3B - For each of the following pairs of variables,...Ch. 10.4 - Carl had scores of 90,95,85, and 90 on his first...Ch. 10.4 - The mean of the five numbers given is 50: 20 35 50...Ch. 10.4 - Sue drives 5 mi at 30 mph and ten 5 mi at 50 mph....Ch. 10.4 - Mathematical Connections Explain why the mode...Ch. 10.4 - Prob. 9MCCh. 10.4 - Mathematical Connections The mean of 5,7,9 is 7....Ch. 10.4 - Prob. 11MCCh. 10.4 - Mathematical Connections What does a large...Ch. 10.4 - Mathematical Connections In each pair of variables...Ch. 10.4 - Prob. 14MCCh. 10.4 - Mathematical Connections A student asks, If the...Ch. 10.4 - Mathematical Connections Jose asks, Why can a...Ch. 10.4 - Mathematical Connections Suppose the class takes a...Ch. 10.4 - Mathematical Connections A student asks if it is...Ch. 10.4 - Prob. 21MCCh. 10.4 - Mathematical Connections A student asks if it is...Ch. 10.4 - Mathematical Connections Mels mean on 10 tests for...Ch. 10.4 - Prob. 24MCCh. 10.4 - Mathematical Connections Given the bar graph...Ch. 10.4 - Mathematical Connections Following are raw test...Ch. 10.4 - National Assessment of Educational Progress NAEP...Ch. 10.4 - National Assessment of Educational Progress NAEP...Ch. 10.4 - Prob. 3NAEPCh. 10.4A - Assessment Calculate the mean, the median, and the...Ch. 10.4A - Prob. 2ACh. 10.4A - Assessment a. If three students scored 75 on a...Ch. 10.4A - Prob. 4ACh. 10.4A - Assessment Suppose in Selinas class there were...Ch. 10.4A - Prob. 6ACh. 10.4A - Prob. 7ACh. 10.4A - Prob. 8ACh. 10.4A - Prob. 9ACh. 10.4A - Prob. 10ACh. 10.4A - Prob. 11ACh. 10.4A - Prob. 12ACh. 10.4A - Prob. 13ACh. 10.4A - Prob. 14ACh. 10.4A - Assessment Following are box plots comparing the...Ch. 10.4A - Prob. 16ACh. 10.4A - Prob. 17ACh. 10.4A - Assessment What is the standard deviation of the...Ch. 10.4A - Prob. 19ACh. 10.4A - Prob. 20ACh. 10.4A - Assume a normal distribution and that the average...Ch. 10.4A - Prob. 22ACh. 10.4A - Prob. 23ACh. 10.4A - Prob. 24ACh. 10.4A - Prob. 25ACh. 10.4A - Prob. 26ACh. 10.4A - Prob. 27ACh. 10.4B - Calculate the mean, the median, and the mode for...Ch. 10.4B - Prob. 2ACh. 10.4B - Prob. 3ACh. 10.4B - Prob. 4ACh. 10.4B - Prob. 5ACh. 10.4B - Prob. 6ACh. 10.4B - a. Mr. Alberto wanted to count the score on a term...Ch. 10.4B - Prob. 9ACh. 10.4B - Prob. 10ACh. 10.4B - Prob. 11ACh. 10.4B - Prob. 12ACh. 10.4B - Prob. 13ACh. 10.4B - Ginnys median score on three tests was 90. Her...Ch. 10.4B - Prob. 15ACh. 10.4B - Prob. 16ACh. 10.4B - a. If all the numbers in a set are equal, what is...Ch. 10.4B - In a school system, teachers start at a salary of...Ch. 10.4B - Prob. 20ACh. 10.4B - Prob. 21ACh. 10.4B - Prob. 22ACh. 10.4B - The weights of newborn babies in a certain country...Ch. 10.4B - Prob. 24ACh. 10.4B - Prob. 25ACh. 10.4B - Prob. 26ACh. 10.4B - Prob. 27ACh. 10.5 - Discuss the effect on the appearance of a graph...Ch. 10.5 - Words such as may as in may help with reading...Ch. 10.5 - Prob. 3MCCh. 10.5 - Prob. 4MCCh. 10.5 - Prob. 5MCCh. 10.5 - Prob. 6MCCh. 10.5 - Following are the record swimming times of the...Ch. 10.5 - National Assessment of Educational Progress NAEP...Ch. 10.5 - Richard wants to estimate the average mean monthly...Ch. 10.5 - Prob. 3NAEPCh. 10.5A - Assessment The city of Podunk advertised itself as...Ch. 10.5A - Prob. 3ACh. 10.5A - Prob. 4ACh. 10.5A - Prob. 5ACh. 10.5A - Mathematical Connections Refer to the following...Ch. 10.5A - Prob. 9ACh. 10.5A - Prob. 10ACh. 10.5A - Prob. 11ACh. 10.5A - Prob. 12ACh. 10.5A - Prob. 14ACh. 10.5A - Prob. 15ACh. 10.5A - Prob. 16ACh. 10.5B - Prob. 4ACh. 10.5B - Prob. 10ACh. 10.5B - Prob. 11ACh. 10.5B - Prob. 12ACh. 10.5B - Prob. 13ACh. 10.5B - Prob. 14ACh. 10.5B - What are the characteristics that you think a...Ch. 10.5B - Prob. 16ACh. 10.5B - Prob. 17ACh. 10.5B - Prob. 18ACh. 10.5B - In the figure shown, monthly sales of three...Ch. 10.5B - Prob. 20ACh. 10.CR - Suppose you read that the average family in...Ch. 10.CR - Prob. 2CRCh. 10.CR - Prob. 3CRCh. 10.CR - Prob. 5CRCh. 10.CR - Prob. 6CRCh. 10.CR - The budget for the Wegetem Crime Co. is 2,000,000....Ch. 10.CR - Prob. 8CRCh. 10.CR - Prob. 9CRCh. 10.CR - Prob. 10CRCh. 10.CR - The life expectancies at birth for males and...Ch. 10.CR - Prob. 12CRCh. 10.CR - Prob. 13CRCh. 10.CR - Prob. 14CRCh. 10.CR - Prob. 15CRCh. 10.CR - Prob. 16CRCh. 10.CR - Prob. 17CRCh. 10.CR - Prob. 18CRCh. 10.CR - Prob. 20CRCh. 10.CR - Prob. 21CRCh. 10.CR - Prob. 22CRCh. 10.CR - Prob. 23CRCh. 10.CR - Prob. 24CRCh. 10.CR - Prob. 26CRCh. 10.CR - CHAPTER 10 REVIEW Give examples of several ways to...Ch. 10.CR - Prob. 28CRCh. 10.CR - Prob. 29CRCh. 10.CR - Prob. 30CRCh. 10.CR - Prob. 31CRCh. 10.CR - Prob. 32CRCh. 10 - NOW TRY THIS On the student page shown below, work...Ch. 10 - Prob. 2NTCh. 10 - Prob. 3NTCh. 10 - Prob. 4NTCh. 10 - Prob. 5NTCh. 10 - Prob. 7NTCh. 10 - Prob. 8NTCh. 10 - Prob. 9NTCh. 10 - Prob. 10NTCh. 10 - Prob. 12NTCh. 10 - Prob. 13NT
Knowledge Booster


Learn more about
Need a deep-dive on the concept behind this application? Look no further. Learn more about this topic, subject and related others by exploring similar questions and additional content below.Similar questions
- Table of hours of television watched per week: 11 15 24 34 36 22 20 30 12 32 24 36 42 36 42 26 37 39 48 35 26 29 27 81276 40 54 47 KARKE 31 35 42 75 35 46 36 42 65 28 54 65 28 23 28 23669 34 43 35 36 16 19 19 28212 Using the data above, construct a frequency table according the following classes: Number of Hours Frequency Relative Frequency 10-19 20-29 |30-39 40-49 50-59 60-69 70-79 80-89 From the frequency table above, find a) the lower class limits b) the upper class limits c) the class width d) the class boundaries Statistics 300 Frequency Tables and Pictures of Data, page 2 Using your frequency table, construct a frequency and a relative frequency histogram labeling both axes.arrow_forwardTable of hours of television watched per week: 11 15 24 34 36 22 20 30 12 32 24 36 42 36 42 26 37 39 48 35 26 29 27 81276 40 54 47 KARKE 31 35 42 75 35 46 36 42 65 28 54 65 28 23 28 23669 34 43 35 36 16 19 19 28212 Using the data above, construct a frequency table according the following classes: Number of Hours Frequency Relative Frequency 10-19 20-29 |30-39 40-49 50-59 60-69 70-79 80-89 From the frequency table above, find a) the lower class limits b) the upper class limits c) the class width d) the class boundaries Statistics 300 Frequency Tables and Pictures of Data, page 2 Using your frequency table, construct a frequency and a relative frequency histogram labeling both axes.arrow_forwardA study was undertaken to compare respiratory responses of hypnotized and unhypnotized subjects. The following data represent total ventilation measured in liters of air per minute per square meter of body area for two independent (and randomly chosen) samples. Analyze these data using the appropriate non-parametric hypothesis test. Unhypnotized: 5.0 5.3 5.3 5.4 5.9 6.2 6.6 6.7 Hypnotized: 5.8 5.9 6.2 6.6 6.7 6.1 7.3 7.4arrow_forward
- 13arrow_forward7arrow_forwardEvaluate the double integral ' √ √ (−2xy² + 3ry) dA R where R = {(x,y)| 1 ≤ x ≤ 3, 2 ≤ y ≤ 4} Double Integral Plot of integrand and Region R N 120 100 80- 60- 40 20 -20 -40 2 T 3 4 5123456 This plot is an example of the function over region R. The region and function identified in your problem will be slightly different. Answer = Round your answer to four decimal places.arrow_forward
- Find the values of p for which the series is convergent. P-?- ✓ 00 Σ nº (1 + n10)p n = 1 Need Help? Read It Watch It SUBMIT ANSWER [-/4 Points] DETAILS MY NOTES SESSCALCET2 8.3.513.XP. Consider the following series. 00 Σ n = 1 1 6 n° (a) Use the sum of the first 10 terms to estimate the sum of the given series. (Round the answer to six decimal places.) $10 = (b) Improve this estimate using the following inequalities with n = 10. (Round your answers to six decimal places.) Sn + + Los f(x) dx ≤s ≤ S₁ + Jn + 1 + Lo f(x) dx ≤s ≤ (c) Using the Remainder Estimate for the Integral Test, find a value of n that will ensure that the error in the approximation s≈s is less than 0.0000001. On > 11 n> -18 On > 18 On > 0 On > 6 Need Help? Read It Watch Itarrow_forward√5 Find Lª³ L² y-are y- arctan (+) dy dydx. Hint: Use integration by parts. SolidUnderSurface z=y*arctan(1/x) Z1 2 y 1 1 Round your answer to 4 decimal places.arrow_forwardFor the solid lying under the surface z = √√4-² and bounded by the rectangular region R = [0,2]x[0,2] as illustrated in this graph: Double Integral Plot of integrand over Region R 1.5 Z 1- 0.5- 0 0.5 1 1.5 205115 Answer should be in exact math format. For example, some multiple of .arrow_forward
arrow_back_ios
SEE MORE QUESTIONS
arrow_forward_ios
Recommended textbooks for you
 Elementary Geometry for College StudentsGeometryISBN:9781285195698Author:Daniel C. Alexander, Geralyn M. KoeberleinPublisher:Cengage Learning
 Elementary Geometry For College Students, 7eGeometryISBN:9781337614085Author:Alexander, Daniel C.; Koeberlein, Geralyn M.Publisher:Cengage,
 Glencoe Algebra 1, Student Edition, 9780079039897...AlgebraISBN:9780079039897Author:CarterPublisher:McGraw Hill
 Algebra: Structure And Method, Book 1AlgebraISBN:9780395977224Author:Richard G. Brown, Mary P. Dolciani, Robert H. Sorgenfrey, William L. ColePublisher:McDougal Littell
 Mathematics For Machine TechnologyAdvanced MathISBN:9781337798310Author:Peterson, John.Publisher:Cengage Learning,
 Holt Mcdougal Larson Pre-algebra: Student Edition...AlgebraISBN:9780547587776Author:HOLT MCDOUGALPublisher:HOLT MCDOUGAL
Elementary Geometry for College Students
Geometry
ISBN:9781285195698
Author:Daniel C. Alexander, Geralyn M. Koeberlein
Publisher:Cengage Learning
Elementary Geometry For College Students, 7e
Geometry
ISBN:9781337614085
Author:Alexander, Daniel C.; Koeberlein, Geralyn M.
Publisher:Cengage,
Glencoe Algebra 1, Student Edition, 9780079039897...
Algebra
ISBN:9780079039897
Author:Carter
Publisher:McGraw Hill
Algebra: Structure And Method, Book 1
Algebra
ISBN:9780395977224
Author:Richard G. Brown, Mary P. Dolciani, Robert H. Sorgenfrey, William L. Cole
Publisher:McDougal Littell
Mathematics For Machine Technology
Advanced Math
ISBN:9781337798310
Author:Peterson, John.
Publisher:Cengage Learning,
Holt Mcdougal Larson Pre-algebra: Student Edition...
Algebra
ISBN:9780547587776
Author:HOLT MCDOUGAL
Publisher:HOLT MCDOUGAL
Find number of persons in a part with 66 handshakes Combinations; Author: Anil Kumar;https://www.youtube.com/watch?v=33TgLi-wp3E;License: Standard YouTube License, CC-BY
Discrete Math 6.3.1 Permutations and Combinations; Author: Kimberly Brehm;https://www.youtube.com/watch?v=J1m9sB5XZQc;License: Standard YouTube License, CC-BY
How to use permutations and combinations; Author: Mario's Math Tutoring;https://www.youtube.com/watch?v=NEGxh_D7yKU;License: Standard YouTube License, CC-BY
Permutations and Combinations | Counting | Don't Memorise; Author: Don't Memorise;https://www.youtube.com/watch?v=0NAASclUm4k;License: Standard Youtube License
Permutations and Combinations Tutorial; Author: The Organic Chemistry Tutor;https://www.youtube.com/watch?v=XJnIdRXUi7A;License: Standard YouTube License, CC-BY