
Videos
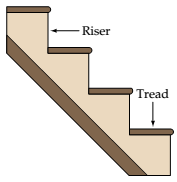
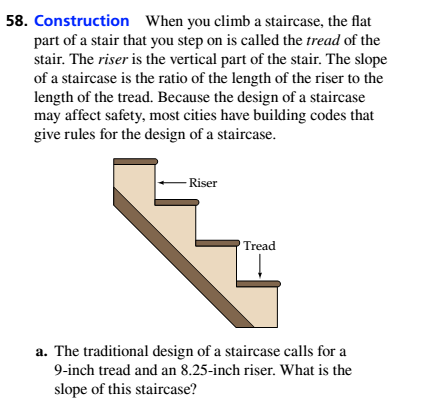
Construction When you climb a staircase, the flat part of a stair that you step on is called the tread of the stair. The riser is the vertical part of the stair. The slope of a staircase is the ratio of the length of the riser to the length of the tread. Because the design of a staircase may affect safety, most cities have building codes that give rules for the design of a staircase.
- The traditional design of a staircase calls for a 9-inch tread and an 8.25-inch riser. What is the slope of this staircase?
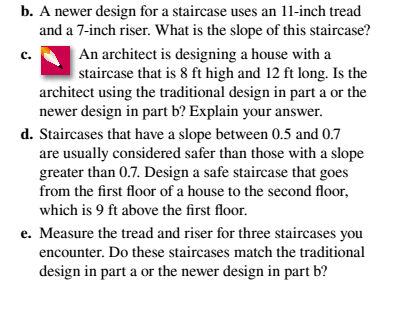
- A newer design for a staircase uses an 11-inch tread and a 7-inch riser. What is the slope of this staircase?
- An architect is designing a house with a staircase that is 8 ft high and 12 ft long. Is the architect using the traditional design in part a or the newer design in part b? Explain your answer.
- Staircases that have a slope between 0.5 and 0.7 are usually considered safer than those with a slope greater than 0.7. Design a safe staircase that goes from the first floor of a house to the second floor, which is 9 ft above the first floor.
- Measure the tread and riser for three staircases you encounter. Do these staircases match the traditional design in part a or the newer design in part b?

Trending nowThis is a popular solution!

Chapter 10 Solutions
WebAssign Printed Access Card for Aufmann/Lockwood/Nation/Clegg's Mathematical Excursions, 4th Edition, Single-Term
Additional Math Textbook Solutions
Calculus: Early Transcendentals (2nd Edition)
APPLIED STAT.IN BUS.+ECONOMICS
Probability And Statistical Inference (10th Edition)
Elementary & Intermediate Algebra
Finite Mathematics for Business, Economics, Life Sciences and Social Sciences


- No chatgpt pls will upvote Alreadyarrow_forwardFind the LaPla se trnsofrom of a) chi-square Distribution. b) Normal Distribution. C) Gamma Distribution. prove that Binomial (n, 2) Poisson (2) *********************arrow_forward2.2, 13.2-13.3) question: 5 point(s) possible ubmit test The accompanying table contains the data for the amounts (in oz) in cans of a certain soda. The cans are labeled to indicate that the contents are 20 oz of soda. Use the sign test and 0.05 significance level to test the claim that cans of this soda are filled so that the median amount is 20 oz. If the median is not 20 oz, are consumers being cheated? Click the icon to view the data. What are the null and alternative hypotheses? OA. Ho: Medi More Info H₁: Medi OC. Ho: Medi H₁: Medi Volume (in ounces) 20.3 20.1 20.4 Find the test stat 20.1 20.5 20.1 20.1 19.9 20.1 Test statistic = 20.2 20.3 20.3 20.1 20.4 20.5 Find the P-value 19.7 20.2 20.4 20.1 20.2 20.2 P-value= (R 19.9 20.1 20.5 20.4 20.1 20.4 Determine the p 20.1 20.3 20.4 20.2 20.3 20.4 Since the P-valu 19.9 20.2 19.9 Print Done 20 oz 20 oz 20 oz 20 oz ce that the consumers are being cheated.arrow_forward
- T Teenage obesity (O), and weekly fast-food meals (F), among some selected Mississippi teenagers are: Name Obesity (lbs) # of Fast-foods per week Josh 185 10 Karl 172 8 Terry 168 9 Kamie Andy 204 154 12 6 (a) Compute the variance of Obesity, s²o, and the variance of fast-food meals, s², of this data. [Must show full work]. (b) Compute the Correlation Coefficient between O and F. [Must show full work]. (c) Find the Coefficient of Determination between O and F. [Must show full work]. (d) Obtain the Regression equation of this data. [Must show full work]. (e) Interpret your answers in (b), (c), and (d). (Full explanations required). Edit View Insert Format Tools Tablearrow_forwardH.w WI M Wz dy A Sindax Sind ①dlmax У тах at 0.75m from A W=6KN/M L=2 W2 = 9 KN/m P= 10 KN Barrow_forwardNo chatgpt pls will upvotearrow_forward
- Q4*) Find the extremals y, z of the the functional 1 = √² (2yz — 2z² + y² — z¹²) dx, - - with y(0) = 0, y(1) = 1, z(0) = 0, z(1) = 0.arrow_forwardlet h0, h1, h2,..., hn,....be the sequence defined by hn = (n C 2), (n choose 2). (n>=0). Determine the generating function for the sequence.arrow_forwardDraw the triangle and show all the workarrow_forward
- The average miles per gallon for a sample of 40 cars of model SX last year was 32.1, with a population standard deviation of 3.8. A sample of 40 cars from this year’s model SX has an average of 35.2 mpg, with a population standard deviation of 5.4. Find a 99 percent confidence interval for the difference in average mpg for this car brand (this year’s model minus last year’s).Find a 99 percent confidence interval for the difference in average mpg for last year’s model minus this year’s. What does the negative difference mean?arrow_forwardA special interest group reports a tiny margin of error (plus or minus 0.04 percent) for its online survey based on 50,000 responses. Is the margin of error legitimate? (Assume that the group’s math is correct.)arrow_forwardSuppose that 73 percent of a sample of 1,000 U.S. college students drive a used car as opposed to a new car or no car at all. Find an 80 percent confidence interval for the percentage of all U.S. college students who drive a used car.What sample size would cut this margin of error in half?arrow_forward


 Elementary Geometry For College Students, 7eGeometryISBN:9781337614085Author:Alexander, Daniel C.; Koeberlein, Geralyn M.Publisher:Cengage,
 Algebra for College StudentsAlgebraISBN:9781285195780Author:Jerome E. Kaufmann, Karen L. SchwittersPublisher:Cengage Learning
 Intermediate AlgebraAlgebraISBN:9781285195728Author:Jerome E. Kaufmann, Karen L. SchwittersPublisher:Cengage Learning