
Concept explainers
Videos
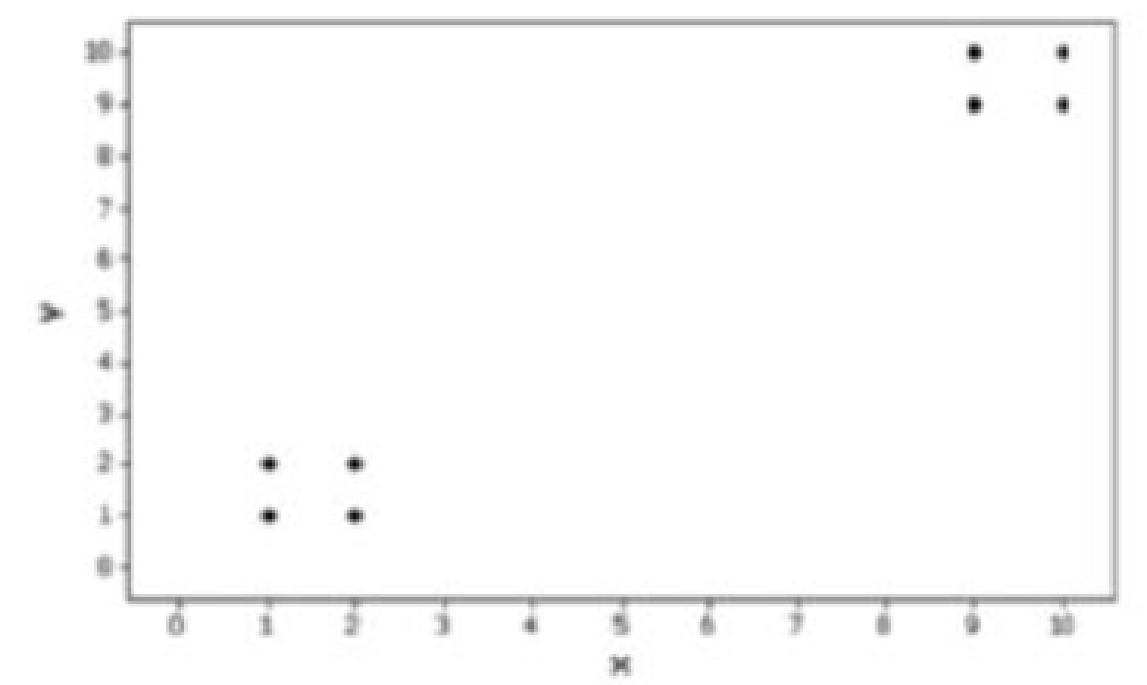
Clusters Refer to the following Minitab-generated
a. Examine the pattern of the four points in the lower left comer (from women) only, and subjectively determine whether there appears to be a
b. Examine the pattern of the four points in the upper right corner (from men) only, and subjectively determine whether there appears to be a correlation between x and y for men.
c. Find the linear
d. Find the value of the linear correlation coefficient using all eight points. What does that value suggest about the relationship between x and y?
e. Based on the preceding results, what do you conclude? Should the data from women and the data from men be considered together, or do they appear to represent two different and distinct populations that should be analyzed separately?
Want to see the full answer?
Check out a sample textbook solution
Chapter 10 Solutions
MYLAB STATISTICS W/ETEXT ACCESS CARD
Additional Math Textbook Solutions
Pathways To Math Literacy (looseleaf)
APPLIED STAT.IN BUS.+ECONOMICS
University Calculus
Math in Our World
University Calculus: Early Transcendentals (4th Edition)


- A company found that the daily sales revenue of its flagship product follows a normal distribution with a mean of $4500 and a standard deviation of $450. The company defines a "high-sales day" that is, any day with sales exceeding $4800. please provide a step by step on how to get the answers in excel Q: What percentage of days can the company expect to have "high-sales days" or sales greater than $4800? Q: What is the sales revenue threshold for the bottom 10% of days? (please note that 10% refers to the probability/area under bell curve towards the lower tail of bell curve) Provide answers in the yellow cellsarrow_forwardFind the critical value for a left-tailed test using the F distribution with a 0.025, degrees of freedom in the numerator=12, and degrees of freedom in the denominator = 50. A portion of the table of critical values of the F-distribution is provided. Click the icon to view the partial table of critical values of the F-distribution. What is the critical value? (Round to two decimal places as needed.)arrow_forwardA retail store manager claims that the average daily sales of the store are $1,500. You aim to test whether the actual average daily sales differ significantly from this claimed value. You can provide your answer by inserting a text box and the answer must include: Null hypothesis, Alternative hypothesis, Show answer (output table/summary table), and Conclusion based on the P value. Showing the calculation is a must. If calculation is missing,so please provide a step by step on the answers Numerical answers in the yellow cellsarrow_forward
 Glencoe Algebra 1, Student Edition, 9780079039897...AlgebraISBN:9780079039897Author:CarterPublisher:McGraw Hill
 Big Ideas Math A Bridge To Success Algebra 1: Stu...AlgebraISBN:9781680331141Author:HOUGHTON MIFFLIN HARCOURTPublisher:Houghton Mifflin Harcourt
 Holt Mcdougal Larson Pre-algebra: Student Edition...AlgebraISBN:9780547587776Author:HOLT MCDOUGALPublisher:HOLT MCDOUGAL
 Functions and Change: A Modeling Approach to Coll...AlgebraISBN:9781337111348Author:Bruce Crauder, Benny Evans, Alan NoellPublisher:Cengage Learning