
Concept explainers
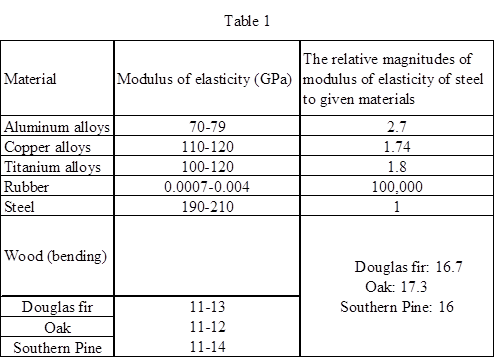
Tabulate the relative magnitudes of modulus of elasticity of steel to aluminum alloys, copper alloys, titanium alloys, rubber, and wood.
Answer to Problem 48P
The relative magnitudes of modulus of elasticity of steel to given materials are tabulated in Table 1.
Explanation of Solution
The values of modulus of elasticity for the given materials are taken from table 10.5 in the text book.
The modulus of elasticity of steel
Determining the average modulus of elasticity value for aluminum alloy is,
Determining the average modulus of elasticity value for copper alloy is,
Determining the average modulus of elasticity for titanium alloy is,
Determining the average modulus of elasticity for rubber is,
Determining the average modulus of elasticity for steel is,
Determining the average modulus of elasticity for Douglas fir is,
Determining the average modulus of elasticity for oak is,
Determining the average modulus of elasticity for Southern Pine is,
Thus, the determined relative magnitudes of modulus of elasticity of steel to given materials are tabulated in table 1.
The Table 1 shows the material, modulus of elasticity, and the relative magnitudes of modulus of elasticity of steel.
Conclusion:
Hence, the relative magnitudes of modulus of elasticity of steel to given materials are tabulated in Table 1.
Want to see more full solutions like this?
Chapter 10 Solutions
Engineering Fundamentals


- Use method of sections to solve all member forces for the diagram dont mind the question down therearrow_forwardThe following data show spot speeds collected at a section of highway located in a residential area before and after an increase in speed enforcement activities. (All speeds are in mi/h.) Before After Before After 44 27 34 21 38 36 35 21 36 23 32 37 41 40 26 26 36 40 38 33 28 32 41 23 32 27 31 24 38 31 36 23 33 22 36 26 44 35 29 23 36 27 31 20 33 18 38 22 40 25 31 26 39 31 33 32 38 33 41 35 Using the student's t-test, determine whether there was a statistically significant difference in the average speeds at a significance level of a = 0.05 (the 95-percent confidence level.) O Yes, there was a statistically significant difference in the average speeds. ○ No, there was not a statistically significant difference in the average speeds. Also report, for both the before and after cases, the mean speed, standard deviation, 85th-percentile speed, and percentage of traffic exceeding the posted speed limit of 30 mi/h. (Enter all speeds and standard deviations in mi/h. Round your 85th-percentile…arrow_forwardCalculate the BMs (bending moments) at all the joints of the beam shown in Fig.1 using the moment distribution method. The beam is subjected to an UDL of w=65m. L=4.5m L1= 1.8m. Assume the support at C is pinned, and A and B are roller supports. E = 200 GPa, I = 250x106 mm4.arrow_forward
- ||| = 1% 11. LTE2 Voi) Vol) 1. LTE1 SEARCH 8 VYT bartleby.com/dashboard ASK √x MATH SOLV affected resale value at year 5, would that affect perceived value-in-use? How exactly? There is an error in submission of question Check it out! See if this is the solution you're looking for VIEW FULL SOLUTION Not what you're looking for? Keep submitting your original question SUBMIT QUESTIONarrow_forward. The average soil weights for a clay are the following: 2,050 pounds in Loose CY, 2,675pounds in Bank CY, and 2,835 pounds in Compacted CY What is the swell percentage for theclay?arrow_forwardA traffic count taken between 7:00 a.m. and 2:00 p.m. on a rural highway found the following hourly volumes. Time 7:00-8:00 a.m. Hourly volume 332 8:00-9:00 a.m. 311 9:00-10:00 a.m. 263 10:00-11:00 a.m. 273 11:00 a.m.-12:00 p.m. 289 12:00-1:00 p.m. 1:00-2:00 p.m. 286 265 If these data were collected on a Tuesday in February, estimate the AADT (in veh/day) on this section of highway. Assume that the expansion factors given in this table, this table, and this table apply. veh/dayarrow_forward
- A project schedule has been updated. The activity placement of spread footing concretewas originally scheduled to begin as early as day 10. The activity duration is 4 days. The actualstart day was day 12. The original schedule had a calculated total float of 7 days for this activity.The recalculated total float for the activity, when updated, would bearrow_forwardIn preparation for a public hearing, an engineer needs to estimate the travel time savings for a proposed highway bypass of a small city in a rural area. The existing highway goes through the downtown area for 4.1 miles between the points where the bypass will connect. (a) If the engineer anticipates a standard deviation of 7 mi/h and would like a 95% confidence of estimating the mean speed within ±4 mi/h, how many runs should a travel time study include? (Enter the minimum number of runs that achieves a 95% confidence level.) runs (b) If the engineer measures an average speed of 34.9 mi/h through the town and the bypass is expected to operate at speeds of 65 mi/h over a distance of 6.2 miles, what is the expected travel time saving (in minutes) per vehicle? minutes Need Help? Read It Watch Itarrow_forwardfollow the instructions and make sure to right the complete solutionarrow_forward
 Engineering Fundamentals: An Introduction to Engi...Civil EngineeringISBN:9781305084766Author:Saeed MoaveniPublisher:Cengage Learning
 Materials Science And Engineering PropertiesCivil EngineeringISBN:9781111988609Author:Charles GilmorePublisher:Cengage Learning
 Construction Materials, Methods and Techniques (M...Civil EngineeringISBN:9781305086272Author:William P. Spence, Eva KultermannPublisher:Cengage Learning
 Fundamentals Of Construction EstimatingCivil EngineeringISBN:9781337399395Author:Pratt, David J.Publisher:Cengage,
 Solid Waste EngineeringCivil EngineeringISBN:9781305635203Author:Worrell, William A.Publisher:Cengage Learning,