(a)
Which process will be employed.
(a)
Explanation of Solution
The total variable cost incurred for each process can be calculated using the following equation:
Given the cost of capital per unit is $5, and the cost of labor per unit is $3. Process 1 requires 5 units of labor and 2 units of capital. Process 2 requires 3 units of labor and 3 units of capital. Process 3 requires 1 unit of labor and 6 units of capital.
Substitute the respective values in Equation 1 to calculate the total variable cost incurred in process 1, which is calculated as follows:
The total variable cost of process 1 is $25.
Table 1 shows the total variable cost of the three processes calculated using Equation 1.
Table 1
| Quantity of capital | Quantity of labor | Total variable cost | |
| Process 1 | 2 | 5 | $ 25.00 |
| Process 2 | 3 | 3 | $ 24.00 |
| Process 3 | 6 | 1 | $ 33.00 |
Since the cheapest cost of production is for process 2, the process to be employed is process 2.
Total Variable Cost: Total variable cost is defined as the cost that depends on the level of production or output of a firm.
(b)
The total variable cost curve.
(b)
Explanation of Solution
Figure 1 shows the total variable cost curve.
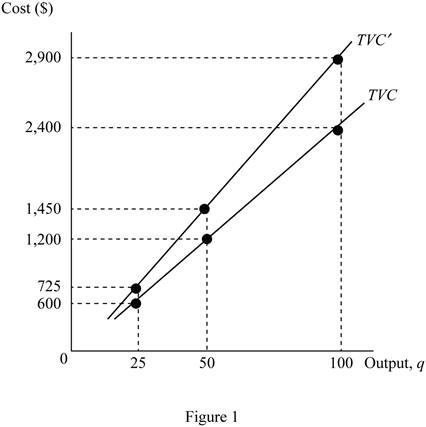
The horizontal axis of Figure 1 measures the quantity of output, and the vertical axis measures the cost. The total variable cost curve is an upward sloping curve as the cost increases the output increases. TVC shows the total variable cost when the cost of capital is $5, and cost of labor is $3 per unit. TVC shows the total variable cost when the cost of capital is $7, and the cost of labor is $3 per unit.
Total Variable Cost: Total variable cost is defined as the cost that depends on the level of production or output of a firm.
(c)
The demand for capital and labor.
(c)
Explanation of Solution
Since 1 unit of output requires 3 units of capital and 3 units of labor using process 1, the amount of capital and labor required to produce any quantity of output can be calculated using Equations 2 and 3.
Substitute the respective values in Equation 2 to calculate the quantity of capital required to produce 25 units of output, which is calculated as follows:
The amount of capital required to produce 25 units of output is 75.
Similarly, the amount of labor required to produce 25 units of output can be calculated using Equation 3 as follows:
The amount of labor required to produce 25 units of output is 75.
The total variable cost incurred to produce 25 units of output using process 2 can be calculated using Equation 1 as follows:
Thus, the total variable cost to produce 25 units of output is $600.
Table 1 shows the quantity of capital and labor required to produce various levels of output through process 1, which is calculated using Equations (1), (2), and (3).
Table 1
| Quantity of output | Amount of capital required | Amount of labor required | Total variable cost |
| 25 | 75 | 75 | $ 600.00 |
| 50 | 150 | 150 | $ 1,200.00 |
| 100 | 300 | 300 | $ 2,400.00 |
Total Variable Cost: Total variable cost is defined as the cost that depends on the level of production or output of a firm.
(d)
The demand for capital and labor.
(d)
Explanation of Solution
When the cost of capital increases to $7, the total variable cost incurred in process 1 can be calculated by substituting the values in Equation 1 as follows:
Substitute the respective values in Equation 1 to calculate the total variable cost incurred in process 1, which is calculated as follows:
The total variable cost of process 1 is $29.
Table 3 shows the total variable cost of the three processes, which are calculated using Equation (1).
Table 3
| Quantity of capital | Quantity of labor | Total variable cost | |
| Process 1 | 2 | 5 | $ 29.00 |
| Process 2 | 3 | 3 | $ 30.00 |
| Process 3 | 6 | 1 | $ 45.00 |
When the cost of capital increases to $7, the process to be chosen is process 1, as it is the cheapest.
Since 1 unit of output requires 2 units of capital and 5 units of labor using process 1, the amount of capital and labor required to produce any quantity of output can be calculated using Equations 4 and 5.
Substitute the respective values in Equation (4) to calculate the quantity of capital required to produce 25 units of output, which is calculated as follows:
The amount of capital required to produce 25 units of output is 50.
Similarly, the amount of labor required to produce 25 units of output can be calculated using Equation (5) as follows:
The amount of labor required to produce 25 units of output is 125.
The total variable cost incurred to produce 25 units of output using process 1 can be calculated using Equation 1 as follows:
Thus, the total variable cost to produce 25 units of output is $725.
Table 4 shows the quantity of capital and labor required to produce various levels of output through process 1, which is calculated using Equations (1), (4), and (5).
Table 4
| Quantity of output | Amount of capital required | Amount of labor required | Total variable cost |
| 25 | 50 | 125 | $ 725.00 |
| 50 | 100 | 250 | $ 1,450.00 |
| 100 | 200 | 500 | $ 2,900.00 |
Total Variable Cost: Total variable cost is defined as the cost that depends on the level of production or output of a firm.
Want to see more full solutions like this?
Chapter 10 Solutions
Principles Of Microeconomics

- As indicated in the attached image, U.S. earnings for high- and low-skill workers as measured by educational attainment began diverging in the 1980s. The remaining questions in this problem set use the model for the labor market developed in class to walk through potential explanations for this trend. 1. Assume that there are just two types of workers, low- and high-skill. As a result, there are two labor markets: supply and demand for low-skill workers and supply and demand for high-skill workers. Using two carefully drawn labor-market figures, show that an increase in the demand for high skill workers can explain an increase in the relative wage of high-skill workers. 2. Using the same assumptions as in the previous question, use two carefully drawn labor-market figures to show that an increase in the supply of low-skill workers can explain an increase in the relative wage of high-skill workers.arrow_forwardPublished in 1980, the book Free to Choose discusses how economists Milton Friedman and Rose Friedman proposed a one-sided view of the benefits of a voucher system. However, there are other economists who disagree about the potential effects of a voucher system.arrow_forwardThe following diagram illustrates the demand and marginal revenue curves facing a monopoly in an industry with no economies or diseconomies of scale. In the short and long run, MC = ATC. a. Calculate the values of profit, consumer surplus, and deadweight loss, and illustrate these on the graph. b. Repeat the calculations in part a, but now assume the monopoly is able to practice perfect price discrimination.arrow_forward
- how commond economies relate to principle Of Economics ?arrow_forwardCritically analyse the five (5) characteristics of Ubuntu and provide examples of how they apply to the National Health Insurance (NHI) in South Africa.arrow_forwardCritically analyse the five (5) characteristics of Ubuntu and provide examples of how they apply to the National Health Insurance (NHI) in South Africa.arrow_forward

 Principles of Economics (12th Edition)EconomicsISBN:9780134078779Author:Karl E. Case, Ray C. Fair, Sharon E. OsterPublisher:PEARSON
 Engineering Economy (17th Edition)EconomicsISBN:9780134870069Author:William G. Sullivan, Elin M. Wicks, C. Patrick KoellingPublisher:PEARSON
 Principles of Economics (MindTap Course List)EconomicsISBN:9781305585126Author:N. Gregory MankiwPublisher:Cengage Learning
 Managerial Economics: A Problem Solving ApproachEconomicsISBN:9781337106665Author:Luke M. Froeb, Brian T. McCann, Michael R. Ward, Mike ShorPublisher:Cengage Learning
 Managerial Economics & Business Strategy (Mcgraw-...EconomicsISBN:9781259290619Author:Michael Baye, Jeff PrincePublisher:McGraw-Hill Education