
Videos
a)
To determine: The probability of earning more than 10 percent on long-term corporate bonds.
Introduction:
The
Standard deviation refers to the variation in the actual observations from the average.
Z-Score helps to know how many numbers of standard deviations is the raw score or outcome away from the average or mean.
a)
Answer to Problem 28QP
The probability of earning more than 10 percent on long-term corporate bonds is 33.41 percent.
Explanation of Solution
Given information:
Assume that the returns of long-term corporate bonds have a normal distribution. The average return or mean of long-term corporate bonds is 6.4 percent, and the standard deviation is 8.4 percent (Refer to Figure 10.10 in the text).
Determine the probability of having a return greater than 10 percent on long-term government bonds:
Follow the common steps from Step 1 to Step 3 given below. Then, proceed with the Step 4.
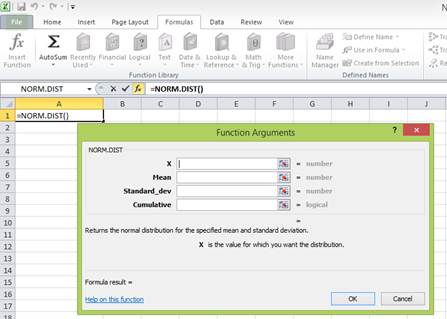
The common steps to be followed to use the “NORM.DIST” function in Excel:
Step 1:
Open an Excel worksheet.
Step 2:
Place the cursor in cell A1.

Step 3:
Select the “Formulas” tab, and go to “More functions” in the ribbon. Under “More functions”, select “Statistical”. Under the drop-down menu of “Statistical”, select “NORM.DIST” function.
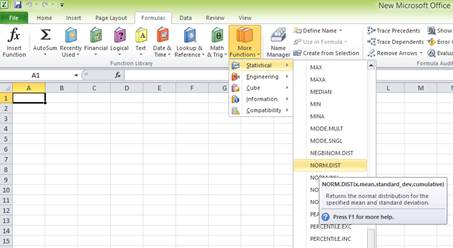
After clicking the “NORM.DIST” function, a popup window named “Function arguments” appears.

Step 4:
Enter the values. “X” represents the raw score or outcome. Here, it is necessary to test the probability of having more than 10 percent returns. Hence, “X” equals 10 percent. The mean or average return is 6.4 percent. The standard deviation is 8.4 percent. The cumulative distribution function provides the probability of the area to the left of Z. Hence, enter “TRUE” in the “Cumulative” column.
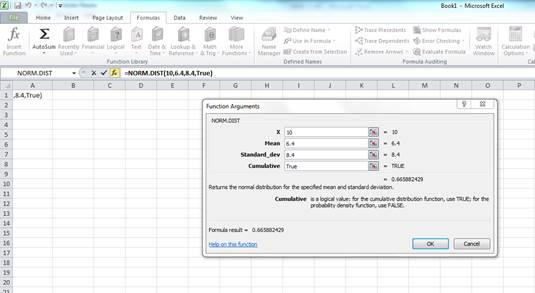
Press “OK” after providing the inputs. The probability of the area to the left of Z is as follows:
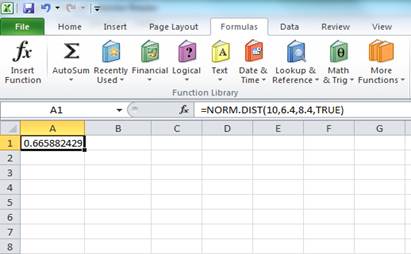
The probability of 0.665882 represents the area to the left of Z. The area to the left of Z is the probability of getting less than 10 percent return. The area to the right of Z is the probability of getting a return of 10 percent or more.
The total area represented by the normal distribution curve has a probability of “1”. The area to the left of Z has a probability of 0.665882. Hence, the probability of the area to the right of Z is “1” minus the probability of the area to the left of Z. Hence, the probability of getting 10 percent return or more is 0.334118 or 33.4118 percent
To determine: The probability of earning less than 0 percent on long-term corporate bonds
Answer to Problem 28QP
The probability of earning less than 0 percent on long-term corporate bonds is 0.223058 or 0.223058 percent
Explanation of Solution
Given information:
Assume that the returns of long-term corporate bonds have a normal distribution. The average return or mean of long-term corporate bonds is 6.4 percent, and the standard deviation is 8.4 percent (Refer to Figure 10.10 in the text).
Determine the probability of having a return less than 0 percent on long-term government bonds:
Follow the common steps from Step 1 to Step 3 given below. Then, proceed with the Step 4.
The common steps to be followed to use the “NORM.DIST” function in Excel:
Step 1:
Open an Excel worksheet.
Step 2:
Place the cursor in cell A1.

Step 3:
Select the “Formulas” tab, and go to “More functions” in the ribbon. Under “More functions”, select “Statistical”. Under the drop-down menu of “Statistical”, select “NORM.DIST” function.

After clicking the “NORM.DIST” function, a popup window named “Function arguments” appears.

Step 4:
Enter the values. “X” represents the raw score or outcome. Here, it is necessary to test the probability of having (0 percent) return or less. Hence, “X” equals (0 percent). The mean or average return is 6.4 percent. The standard deviation is 8.4 percent. The cumulative distribution function provides the probability of the area to the left of Z. Hence, enter “TRUE” in the “Cumulative” column.
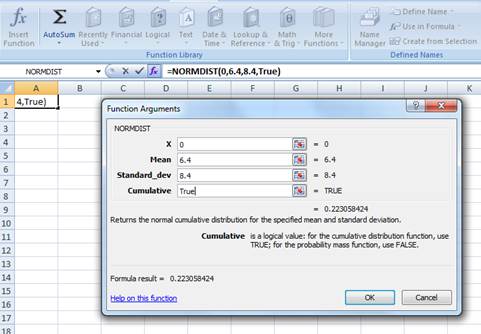
Press “OK” after providing the inputs. The probability of the area to the left of Z is as follows:
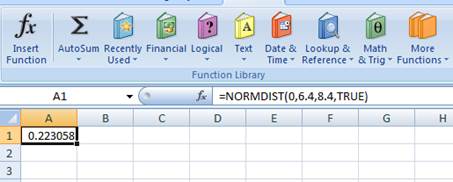
The probability of 0.223058 represents the area to the left of Z. The area to the left of Z refers to the probability of getting (0 percent) return or less because the left-hand side of the normal distribution curve indicates negative returns. Hence, the probability of earning less than 0 percent is 0.223058 or 0.223058 percent.
b)
To determine: The probability of earning more than 10 percent on Treasury bills
b)
Answer to Problem 28QP
The probability of earning more than 10 percent on Treasury bills is 0.018006785 or 1.80 percent.
Explanation of Solution
Given information:
Assume that the returns of Treasury bills have a normal distribution. The average return or mean of Treasury bills is 3.5 percent, and the standard deviation is 3.1 percent (Refer to Figure 10.10 in the textbook).
Determine the probability of having a return greater than 10 percent on Treasury bills:
Follow the common steps from Step 1 to Step 3 given below. Then, proceed with the Step 4.
The common steps to be followed to use the “NORM.DIST” function in Excel:
Step 1:
Open an Excel worksheet.
Step 2:
Place the cursor in cell A1.
Step 3:
Select the “Formulas” tab, and go to “More functions” in the ribbon. Under “More functions”, select “Statistical”. Under the drop-down menu of “Statistical”, select “NORM.DIST” function.

After clicking the “NORM.DIST” function, a popup window named “Function arguments” appears.

Step 4:
Enter the values. “X” represents the raw score or outcome. Here, it is necessary to test the probability of having more than 10 percent returns. Hence, “X” equals 10 percent. The mean or average return is 3.5 percent. The standard deviation is 3.1 percent. The cumulative distribution function provides the probability of the area to the left of Z. Hence, enter “TRUE” in the “Cumulative” column.
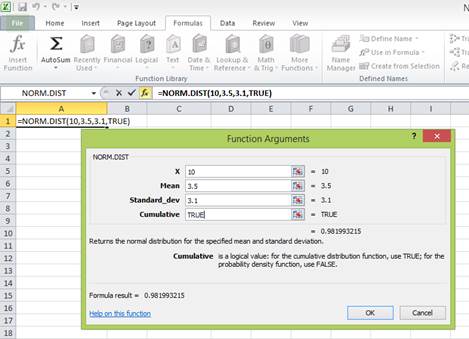
Press “OK” after providing the inputs. The probability of the area to the left of Z is as follows:
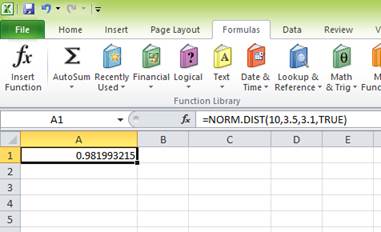
The probability of 0.981993215 represents the area to the left of Z. The area to the left of Z is the probability of getting less than 10 percent return. The area to the right of Z is the probability of getting a return of 10 percent or more.
The total area represented by the normal distribution curve has a probability of “1”. The area to the left of Z has a probability of 0.981993215. Hence, the probability of the area to the right of Z is “1” minus the probability of the area to the left of Z. Hence, the probability of getting 10 percent return or more is 0.018006785 or 1.80 percent
To determine: The probability of earning less than 0 percent on Treasury bills.
Answer to Problem 28QP
The probability of earning less than 0 percent on Treasury bills is 0.129442113 or 12.94 percent.
Explanation of Solution
Given information:
Assume that the returns of Treasury bills have a normal distribution. The average return or mean of Treasury bills is 3.5 percent, and the standard deviation is 3.1 percent (Refer to Figure 10.10 in the text).
Determine the probability of having a return less than 0 percent on Treasury bills:
Follow the common steps from Step 1 to Step 3 given below. Then, proceed with the Step 4.
The common steps to be followed to use the “NORM.DIST” function in Excel:
Step 1:
Open an Excel worksheet.
Step 2:
Place the cursor in cell A1.

Step 3:
Select the “Formulas” tab, and go to “More functions” in the ribbon. Under “More functions”, select “Statistical”. Under the drop-down menu of “Statistical”, select “NORM.DIST” function.
After clicking the “NORM.DIST” function, a popup window named “Function arguments” appears.

Step 4:
Enter the values. “X” represents the raw score or outcome. Here, it is necessary to test the probability of having (0 percent) return or less. Hence, “X” equals (0 percent). The mean or average return is 3.5 percent. The standard deviation is 3.1 percent. The cumulative distribution function provides the probability of the area to the left of Z. Hence, enter “TRUE” in the “Cumulative” column.
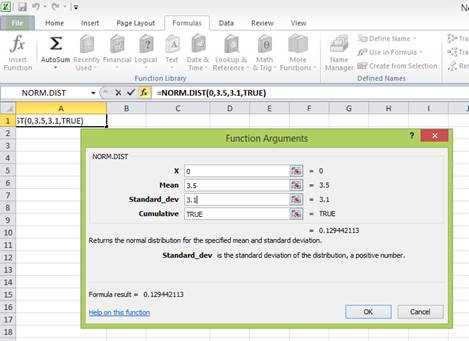
Press “OK” after providing the inputs. The probability of the area to the left of Z is as follows:
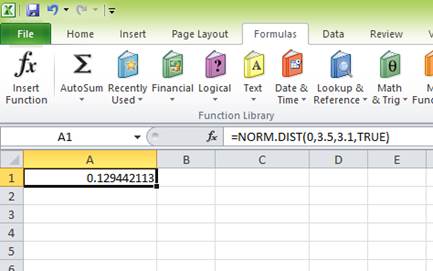
The probability of 0.129442113 represents the area to the left of Z. The area to the left of Z refers to the probability of getting (0 percent) return or less because the left-hand side of the normal distribution curve indicates negative returns. Hence, the probability of earning less than 0 percent is 0.129442113 or 12.94 percent.
c)
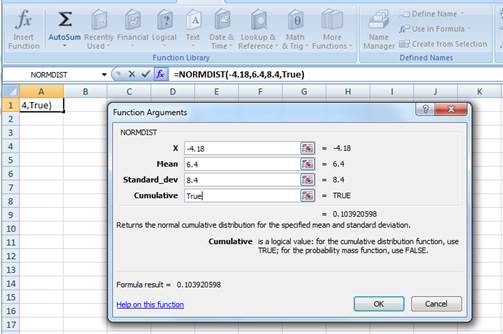
To determine: The probability of earning (4.18 percent) on long-term corporate bonds.
c)
Answer to Problem 28QP
The probability of earning (4.18 percent) on long-term corporate bonds is 0.1039 or 10.39 percent.
Explanation of Solution
Given information:
Assume that the returns of long-term corporate bonds have a normal distribution. The average return or mean of long-term corporate bonds is 6.4 percent, and the standard deviation is 8.4 percent (Refer to Figure 10.10 in the textbook).
Determine the probability of having (4.18 percent) on long-term government bonds:
Follow the common steps from Step 1 to Step 3 given below. Then, proceed with the Step 4.
The common steps to be followed to use the “NORM.DIST” function in Excel:
Step 1:
Open an Excel worksheet.
Step 2:
Place the cursor in cell A1.

Step 3:
Select the “Formulas” tab, and go to “More functions” in the ribbon. Under “More functions”, select “Statistical”. Under the drop-down menu of “Statistical”, select “NORM.DIST” function.
After clicking the “NORM.DIST” function, a popup window named “Function arguments” appears.
Step 4:
Enter the values. “X” represents the raw score or outcome. Here, it is necessary to test the probability of having (4.18 percent) return or less. Hence, “X” equals (4.18 percent). The mean or average return is 6.4 percent. The standard deviation is 8.4 percent. The cumulative distribution function provides the probability of the area to the left of Z. Hence, enter “TRUE” in the “Cumulative” column.
Press “OK” after providing the inputs. The probability of the area to the left of Z is as follows:
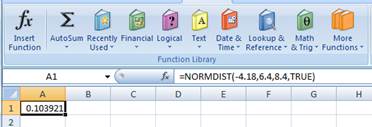
The probability of 0.103921 represents the area to the left of Z. The area to the left of Z refers to the probability of getting (4.18 percent) return or less because the left-hand side of the normal distribution curve indicates negative returns. Hence, the probability of earning (4.18 percent) is 0.1039 or 10.39 percent.
To determine: The probability of earning 10.56 percent on Treasury bills.
Answer to Problem 28QP
The probability of earning 10.56 percent on Treasury bills is 0.011380598 or 1.14 percent
Explanation of Solution
Given information:
Assume that the returns of Treasury bills have a normal distribution. The average return or mean of Treasury bills is 3.5 percent, and the standard deviation is 3.1 percent (Refer to Figure 10.10 in the text).
Determine the probability of having a return of 10.56 percent on Treasury bills:
Follow the common steps from Step 1 to Step 3 given below. Then, proceed with the Step 4.
The common steps to be followed to use the “NORM.DIST” function in Excel:
Step 1:
Open an Excel worksheet.
Step 2:
Place the cursor in cell A1.

Step 3:
Select the “Formulas” tab, and go to “More functions” in the ribbon. Under “More functions”, select “Statistical”. Under the drop-down menu of “Statistical”, select “NORM.DIST” function.
After clicking the “NORM.DIST” function, a popup window named “Function arguments” appears.
Step 4:
Enter the values. “X” represents the raw score or outcome. Here, it is necessary to test the probability of having 10.56 percent returns. Hence, “X” equals 10.56 percent. The mean or average return is 3.5 percent. The standard deviation is 3.1 percent. The cumulative distribution function provides the probability of the area to the left of Z. Hence, enter “TRUE” in the “Cumulative” column.
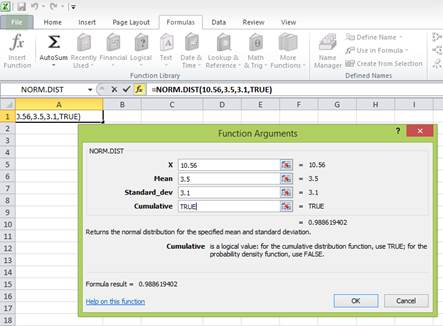
Press “OK” after providing the inputs. The probability of the area to the left of Z is as follows:
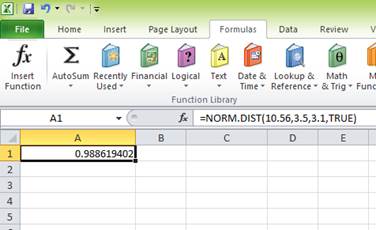
The probability of 0.988619402 represents the area to the left of Z. The area to the left of Z is the probability of getting less than 10.56 percent return. The area to the right of Z is the probability of getting a return of 10.56 percent or more.
The total area represented by the normal distribution curve has a probability of “1”. The area to the left of Z has a probability of 0.988619402. Hence, the probability of the area to the right of Z is “1” minus the probability of the area to the left of Z. Hence, the probability of getting 10.56 percent return or more is 0.011380598 or 1.14 percent
Want to see more full solutions like this?
Chapter 10 Solutions
Essentials of Corporate Finance


- critically discuss the hockey stick model of a start-up financing. In your response, explain the model and discibe its three main stages, highlighting the key characteristics of each stage in terms of growth, risk, and funding expectations.arrow_forwardSolve this problem please .arrow_forwardSolve this finance question.arrow_forward
- solve this question.Pat and Chris have identical interest-bearing bank accounts that pay them $15 interest per year. Pat leaves the $15 in the account each year, while Chris takes the $15 home to a jar and never spends any of it. After five years, who has more money?arrow_forwardWhat is corporate finance? explain all thingsarrow_forwardSolve this finance problem.arrow_forward
 Intermediate Financial Management (MindTap Course...FinanceISBN:9781337395083Author:Eugene F. Brigham, Phillip R. DavesPublisher:Cengage Learning
