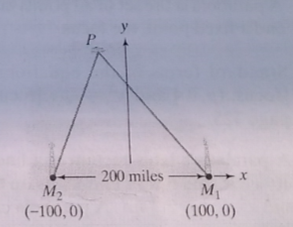
Radio tower M 2 is located 200 miles due west of radiotower M 1 . The situation is illustrated in the figure shown, where a coordinate system has been superimposed. Simultaneous radio signals are sent from each tower to a ship, with the signal from M 2 received 500 microseconds before the signal from M 1 . Assuming that radio signals travelat 0.186 mile per microsecond, determine the equation of thehyperbola on which the ship is located.
Radio tower M 2 is located 200 miles due west of radiotower M 1 . The situation is illustrated in the figure shown, where a coordinate system has been superimposed. Simultaneous radio signals are sent from each tower to a ship, with the signal from M 2 received 500 microseconds before the signal from M 1 . Assuming that radio signals travelat 0.186 mile per microsecond, determine the equation of thehyperbola on which the ship is located.
Solution Summary: The author calculates the standard equation of a hyperbola: ca2a=500times 0.186
Radio tower M2 is located 200 miles due west of radiotower
M
1
. The situation is illustrated in the figure shown, where a coordinate system has been superimposed. Simultaneous radio signals are sent from each tower to a ship, with the signal from M2 received 500 microseconds before the signal from
M
1
. Assuming that radio signals travelat 0.186 mile per microsecond, determine the equation of thehyperbola on which the ship is located.
System that uses coordinates to uniquely determine the position of points. The most common coordinate system is the Cartesian system, where points are given by distance along a horizontal x-axis and vertical y-axis from the origin. A polar coordinate system locates a point by its direction relative to a reference direction and its distance from a given point. In three dimensions, it leads to cylindrical and spherical coordinates.
Solve questions by Course Name (Ordinary Differential Equations II 2)
please Solve questions by Course Name( Ordinary Differential Equations II 2)
InThe Northern Lights are bright flashes of colored light between 50 and 200 miles above Earth.
Suppose a flash occurs 150 miles above Earth. What is the measure of arc BD, the portion of Earth
from which the flash is visible? (Earth’s radius is approximately 4000 miles.)
Intro Stats, Books a la Carte Edition (5th Edition)
Knowledge Booster
Learn more about
Need a deep-dive on the concept behind this application? Look no further. Learn more about this topic, algebra and related others by exploring similar questions and additional content below.


 Algebra & Trigonometry with Analytic GeometryAlgebraISBN:9781133382119Author:SwokowskiPublisher:Cengage
 Mathematics For Machine TechnologyAdvanced MathISBN:9781337798310Author:Peterson, John.Publisher:Cengage Learning,
 Holt Mcdougal Larson Pre-algebra: Student Edition...AlgebraISBN:9780547587776Author:HOLT MCDOUGALPublisher:HOLT MCDOUGAL
 College Algebra (MindTap Course List)AlgebraISBN:9781305652231Author:R. David Gustafson, Jeff HughesPublisher:Cengage Learning
 Trigonometry (MindTap Course List)TrigonometryISBN:9781337278461Author:Ron LarsonPublisher:Cengage Learning