
Identify the effect of the events on the quantity of real
Explanation of Solution
- The U.S firm move their call handling, IT, and data function to Country I:
A movement of call handling, IT, and data function from the U.D firm to Country I’s firm will cause an expansion of a business. In order to expand the business of the firm, it will result in demanding new capital, increase employment, and production. Therefore, the quantity of real GDP supplies and aggregate supply will increase.
Figure -1 shows the effect of movement of business from one firm to other firms as follows:

In Figure -1, the horizontal axis measures real GDP and the vertical axis measures
In Figure -1, the curve short-run aggregate supply (SAS), long-run
- Fuel price rise:
A rise in fuel price will result in an increase in the price level, which will rise the cost of production and temporarily decrease the aggregate supply. This will cause the short-run supply shift to the leftward direction and long-run aggregate supply curve remain unchanged.
Figure -2 shows the impact of rising in fuel price as follows:

In Figure -2, the horizontal axis measures real GDP and the vertical axis measures price level.
In Figure -2, point E represents the initial equilibrium of the economy. Since as the rise in price cause a temporary decrease in short-run aggregate supply, which result in short-run aggregate supply curve shift to the leftward direction. Therefore, point E1 represents the new equilibrium point and SAS1 is the new short-run aggregate supply curve.
- Walmart and Starbucks open in Country I:
The Walmart and Starbucks open in Country I, which causes an expansion of their business. In order to expend the business of the firm, which will result in demanding new capital, increased employment, and production. Therefore, the quantity of real GDP supplies and aggregate supply will increase.
Figure -3 shows the effect of the expansion of business from one country to another country as follows:
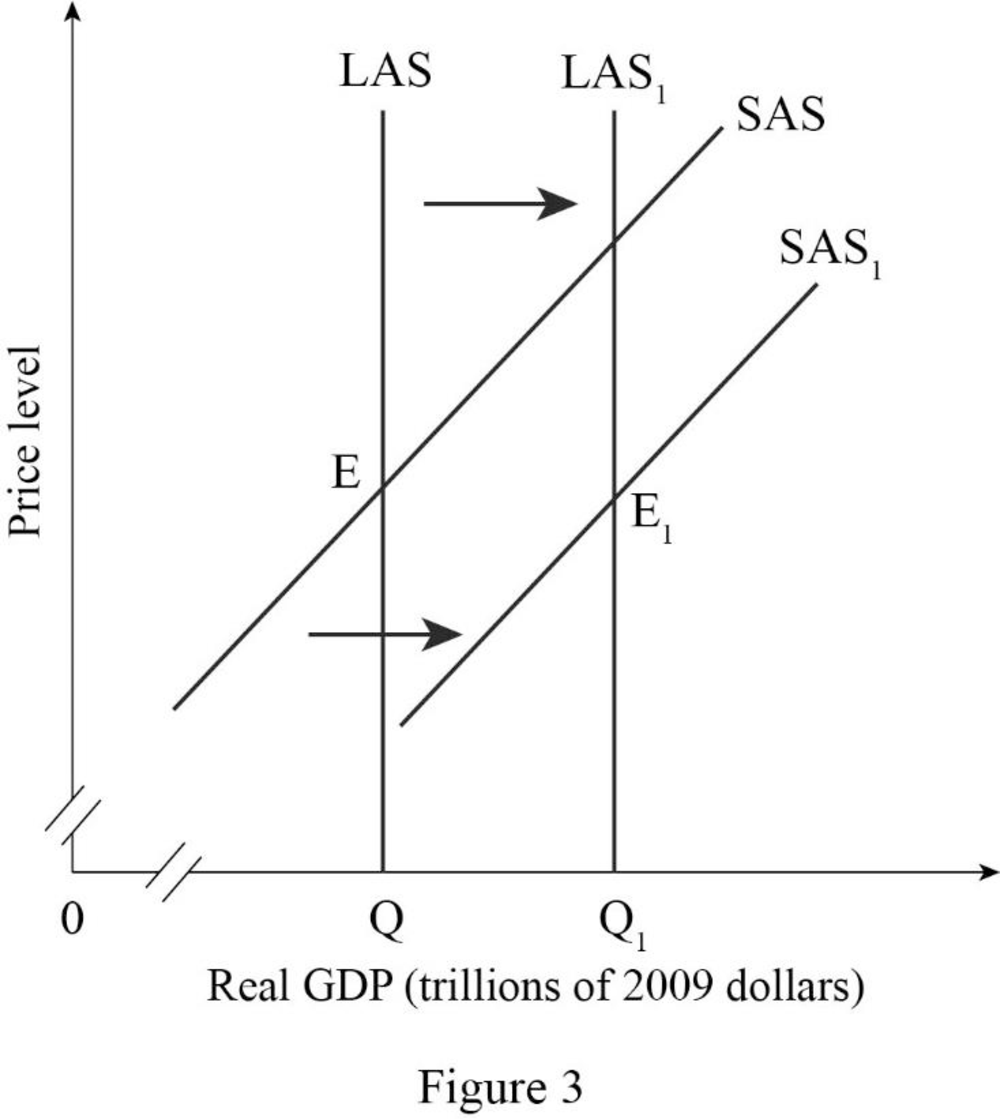
In Figure -3, the horizontal axis measures real GDP and the vertical axis measures price level.
In Figure -3, the curve short-run aggregate supply (SAS), long-run aggregate supply curve (LAS) at output Q represents the initial outcome of the economy. The result of the expansion of a business into one country to another country will cause an increase in long-run aggregate supply and short run aggregate supply and will result in a long-run aggregate supply curve (LAS1) and short-run aggregate supply curve (SAS1) shift to the rightward direction.
- Universities in the Country I increase the number of engineering graduates.
An increase in the number of engineering graduates in Country I will result in an increase in human capital and opportunity of employment expansion. Therefore, the quantity of real GDP supplies and aggregate supply will increase.
Figure -4 shows the effect of expansion of business from one country to another country as follows:

In Figure -4, the horizontal axis measures real GDP and the vertical axis measures price level.
In Figure -4, the curve short-run aggregate supply (SAS), long-run aggregate supply curve (LAS) at output Q represents the initial outcome of the economy. The result of an increase in the human capital and employment opportunity will cause an increase in long-run aggregate supply and short-run aggregate supply, which will result in a long-run aggregate supply curve (LAS1) and short-run aggregate supply curve (SAS1) shift to the rightward direction.
- The money wage rate rises:
An increase in the money wage rate causes an increase in the cost of production of the firm because with the existing employment rate, the firm will pay a high salary or wage for the same quantity of output. Therefore, there occur a temporarily decrease in the aggregate supply, which will cause the short-run supply to shift to the leftward direction and long-run aggregate supply curve remain unchanged.
Figure -5 shows the effect of a rise in the money wage rate as follows:
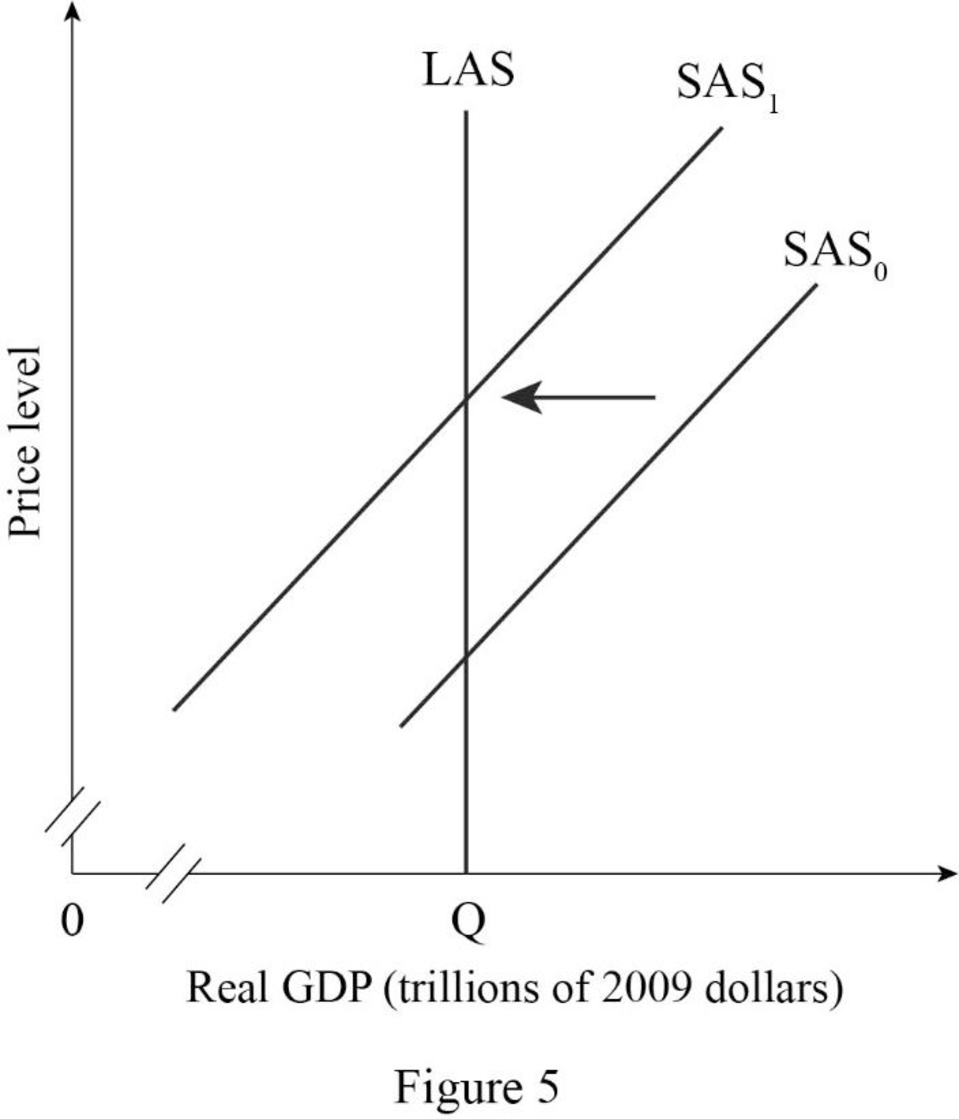
In Figure -5, the horizontal axis measures real GDP and the vertical axis measures price level.
In Figure -5, point E represents the initial equilibrium of the economy. Since as a rise in money wage rate causes a temporary decrease in short-run aggregate supply, which results in short-run aggregate supply curve shift to the leftward direction. Therefore, point E1 represents new equilibrium point and SAS1 is the new short-run aggregate supply curve.
- The price level in Country I increases:
In the short-run, an increase in the price level in the Country I cause an increase in the quantity supply of real GDP. Since an increase in price level causes an increase in the money wage rate, hence, in the long run, there occur an upward movement or real GDP along with long-run aggregate supply curve.
Figure -6 shows the impact of rise in the price level in Country I as follows:
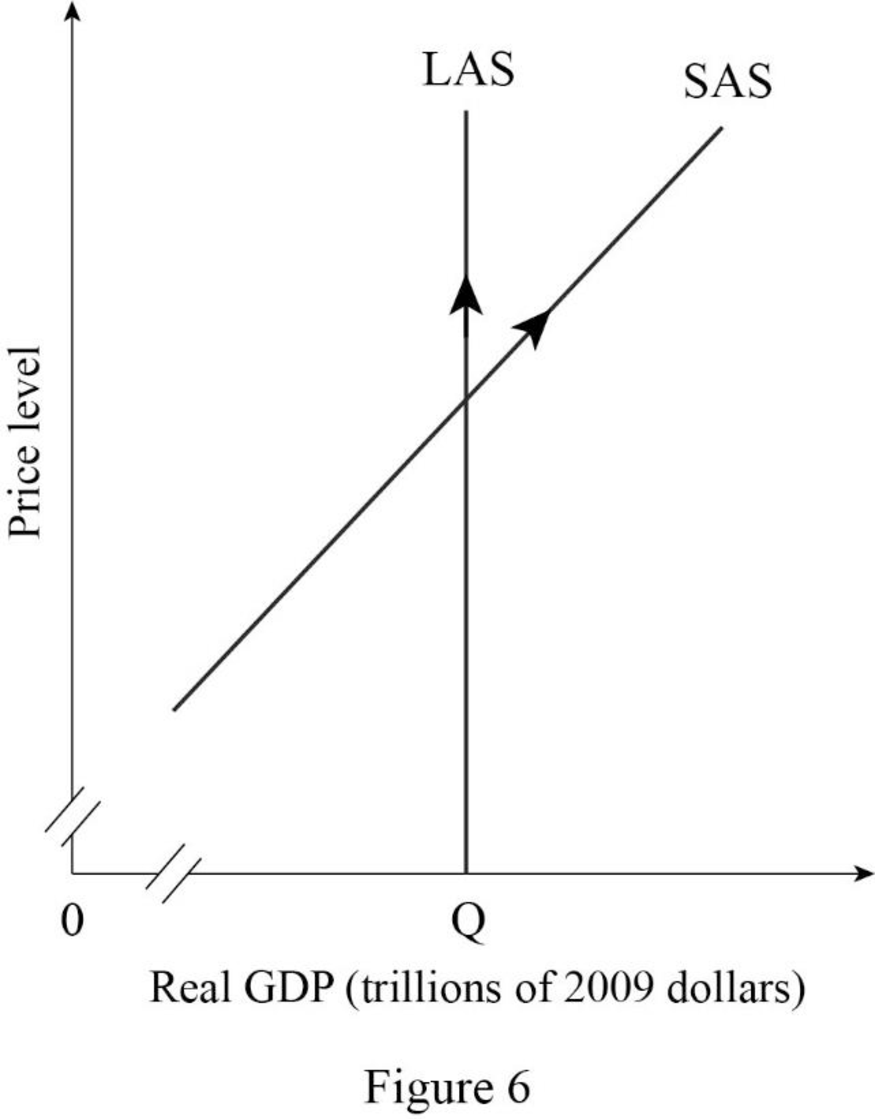
In Figure -6, the horizontal axis measures real GDP and the vertical axis measures price level.
In Figure -6, a rising in the price level causes a rise in money wage rate, hence in the long-run, the quantity supplied of real GDP increases. Therefore, there occurs an upward movement along with the long-run aggregate supply curve and the short-run aggregate supply curve.
Want to see more full solutions like this?
Chapter 10 Solutions
Macroeconomics (12th Edition) (Pearson Series in Economics)

- In what ways could you show the attractiveness of Philippines in the form of videos/campaigns to foreign investors? Cite 10 examples.arrow_forwardExplain the following terms and provide an example for each term: • Corruption • Fraud • Briberyarrow_forwardIn what ways could you show the attractiveness of a country in the form of videos/campaigns?arrow_forward
- With the VBS scenario in mind, debate with your own words the view that stakeholders are the primary reason why business ethics must be implemented.arrow_forwardThe unethical decisions taken by the VBS management affected the lives of many of their clients who trusted their business and services You are appointed as an ethics officer at Tyme Bank. Advise the management regarding the role of legislation in South Africa in providing the legal framework for business operations.arrow_forwardTyme Bank is a developing bank in South Africa and could potentially encounter challenges similar to those faced by VBS in the future. Explain five (5) benefits of applying business ethics at Tyme Bank to prevent similar ethical scandals.arrow_forward
- 1.3. Explain the five (5) ethical challenges that can be associated with the implementation of the National Health Insurance (NHI) in South Africa.arrow_forward1.2. Fourie (2018:211) suggests that Ubuntu emphasises the willingness to share and participate in a community. However, it does not privilege the community over the dignity and life of the individual. With the above in mind, discuss how the implementation of the National Health Insurance (NHI) is a way to uphold the concept of Ubuntu.arrow_forwardWhat are the 15 things/places/foods/culture or any strategies that could showcase the attractiveness of the Philippines to foreign investors? Use factual information in each strategies and discuss.arrow_forward
- Two firms are competing in a Cournot duopoly. Both firms have the same constant marginal cost. The market demand is linear. Suppose the constant marginal cost of firm 2 is increasing. Which of the following statements are correct? [There may be more than one correct statement.] The quantity of firm 1 and the quantity of firm 2 both go up. The quantity of firm 1 goes up and the quantity of firm 2 goes down. The market price goes down. The market price goes up. The quantity of firm 1 and the quantity of firm 2 go down. The quantity of firm 1 goes down and the quantity of firm 2 goes up. The market price stays the same.arrow_forwardevaluate the impact of government interventions, such as antitrust regulations, price controls, or subsidies, on various market structures. Select a specific industry and examine how these interventions have influenced competition, consumer welfare, and economic efficiency. Provide the pros and cons of government intervention.arrow_forwardConsider an economy that exhibits both population growth (L grows at rate n) and technological progress (A grows at rate a) described by the production function, Y = F(K, AL) = Ka (AL)¹-α Here K is capital and Y is output. (a) Show that this production function exhibits constant returns to scale. [2 marks] (b) What is the per-effective-worker production function, y = f(k), (where y = Y/AL k K/AL)? (Show your working.) [2 marks] (c) Find expressions for the steady-state capital-output ratio, capital stock per effective worker, and output per effective worker, as a function of the saving rate (s), the depreciation rate (8), the population growth rate (n), the rate of technological progress (a), and the coefficient a. (You may assume the condition that capital per effective worker evolves according to Ak = sf (k) - (a+n+8)k.) [5 marks] (d) Show that at the Golden Rule steady state the saving rate for this economy is equal to the parameter a. [6 marks]arrow_forward

 Macroeconomics: Private and Public Choice (MindTa...EconomicsISBN:9781305506756Author:James D. Gwartney, Richard L. Stroup, Russell S. Sobel, David A. MacphersonPublisher:Cengage Learning
 Economics: Private and Public Choice (MindTap Cou...EconomicsISBN:9781305506725Author:James D. Gwartney, Richard L. Stroup, Russell S. Sobel, David A. MacphersonPublisher:Cengage Learning
 Exploring EconomicsEconomicsISBN:9781544336329Author:Robert L. SextonPublisher:SAGE Publications, Inc
 Economics (MindTap Course List)EconomicsISBN:9781337617383Author:Roger A. ArnoldPublisher:Cengage Learning