
Concept explainers
Videos
NASDAQ 100 Stocks For Exercises 1-10, the data come from a random sample of 20 companies of the NASDAQ 100 taken on June 8, 2017. (Data from: www.morningstar.com.)
For Exercises 1 and 2, (a) write a frequency distribution; (b) draw a histogram.
The variable is the price of the stock (rounded to the nearest dollar).
| 123 | 35 | 76 | 38 |
| 45 | 62 | 50 | 111 |
| 180 | 108 | 65 | 46 |
| 66 | 100 | 64 | 144 |
| 57 | 107 | 48 | 110 |
(a)
Explanation of Solution
Given:
Consider the data came from a random sample of 20 companies of NASDAQ 100
| 123 | 35 | 76 | 38 |
| 45 | 62 | 50 | 111 |
| 180 | 108 | 65 | 46 |
| 66 | 100 | 64 | 144 |
| 57 | 107 | 48 | 110 |
Calculation:
To draw the frequency table, sort the data set
35,38,45, 46,48,50,57,62,64,65,66,76,100,107,108,110,111,123,144,180
There is no repetition of data therefore the frequency of occurrence is 1 for all the data set hence the frequency distribution is
| 35 | 1 | 66 | 1 |
| 38 | 1 | 76 | 1 |
| 45 | 1 | 100 | 1 |
| 46 | 1 | 107 | 1 |
| 48 | 1 | 108 | 1 |
| 50 | 1 | 110 | 1 |
| 57 | 1 | 111 | 1 |
| 62 | 1 | 123 | 1 |
| 64 | 1 | 144 | 1 |
| 65 | 1 | 180 | 1 |
(b)
To graph: Draw the histogram corresponding to the corresponding to the data came from a random sample of 20 companies of NASDAQ 100.
Explanation of Solution
Given:
Consider the data came from a random sample of 20 companies of NASDAQ 100
| 123 | 35 | 76 | 38 |
| 45 | 62 | 50 | 111 |
| 180 | 108 | 65 | 46 |
| 66 | 100 | 64 | 144 |
| 57 | 107 | 48 | 110 |
Calculation:
To draw the frequency table sort the data set
35,38,45, 46,48,50,57,62,64,65,66,76,100,107,108,110,111,123,144,180
There is no repetition of data therefore the frequency of occurrence is 1 for all the data set hence the frequency distribution is
| 35 | 1 | 66 | 1 |
| 38 | 1 | 76 | 1 |
| 45 | 1 | 100 | 1 |
| 46 | 1 | 107 | 1 |
| 48 | 1 | 108 | 1 |
| 50 | 1 | 110 | 1 |
| 57 | 1 | 111 | 1 |
| 62 | 1 | 123 | 1 |
| 64 | 1 | 144 | 1 |
| 65 | 1 | 180 | 1 |
| Range | Frequency |
| 20-40 | 2 |
| 40-60 | 5 |
| 60-80 | 5 |
| 80-100 | 0 |
| 100-120 | 5 |
| 120-140 | 1 |
| 140-160 | 1 |
| 160-180 | 0 |
| 180-200 | 1 |
The y-axis represents frequency with a scale of
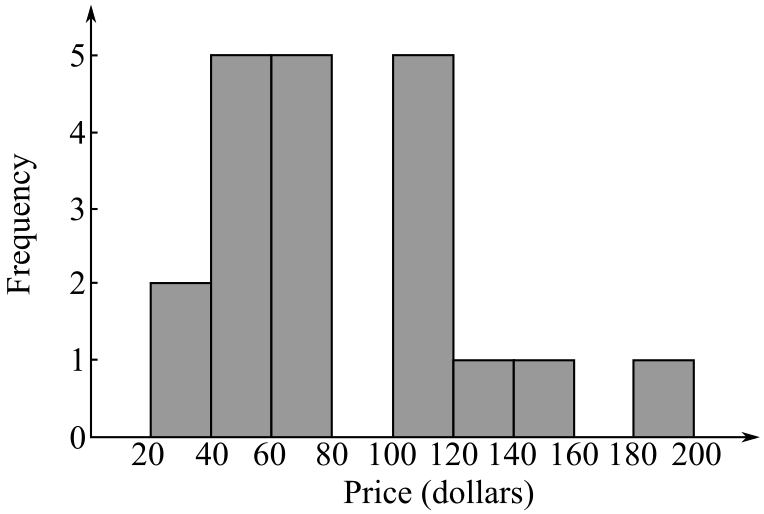
Hence, the histogram corresponding to the corresponding to the data came from a random sample of 20 companies of NASDAQ 100 is drawn.
Want to see more full solutions like this?
Chapter 10 Solutions
Mathematics with Applications In the Management, Natural, and Social Sciences (12th Edition)


- 8.12 The reading on a voltage meter connected to a test circuit is uniformly distributed over the interval (0, +1), where 0 is the true but unknown voltage of the circuit. Suppose that Y₁, Y2,..., Y, denote a random sample of such readings. a Show that Y is a biased estimator of and compute the bias. b Find a function of Y that is an unbiased estimator of 0. C Find MSE(Y) when Y is used as an estimator of 0.arrow_forwardx 1.1 1.2 1.3 f 3.1 3.9 य find numerical f'(1) by using approximation.arrow_forwardNo chatgpt pls will upvote Already got wrong chatgpt answer Plz no chatgpt downvote.arrow_forward
- Q/Let G be a simple graph-show that if Gis not connected, then it is complement is Connected.arrow_forwardQ/prove that if d (u,v) >2 then there is a vertex z in G st. d (u,v) = d(u, z)+d(z₁v)arrow_forwardT Figure E Statement 33 33° H 40 R 37° 83° S T 55 45 K S 30 U 44 87 H 56 36 ° 54 F 83° 66 P 33 87° ° I 42 200 Rarrow_forward
- Qui find the diameter & radius for a graph PG.arrow_forwardQ7. Prove that " there is no simple graph on four vertices, three of which have degree 3 and the remaining vertex has degree 1". (10M)arrow_forwardStella's friends got her a skydiving lesson for her birthday. Her helicopter took off from the skydiving center, ascending in an angle of 37°, and traveled a distance of 2.1 kilometers before she fell in a straight line perpendicular to the ground. How far from the skydiving center did Stella land? Be sure to have all three parts of a CER answer: make a claim, provide evidence, and explain your reasoning for full credit. 2.1 km Landing spot 37% Skydiving centerarrow_forward
- Solve please thanks!arrow_forwardSolve please and thank youarrow_forwardAccording to Newton's law of universal gravitation, the force F between two bodies of constant mass GmM m and M is given by the formula F = , where G is the gravitational constant and d is the d² distance between the bodies. a. Suppose that G, m, and M are constants. Find the rate of change of force F with respect to distance d. F' (d) 2GmM b. Find the rate of change of force F with gravitational constant G = 6.67 × 10-¹¹ Nm²/kg², on two bodies 5 meters apart, each with a mass of 250 kilograms. Answer in scientific notation, rounding to 2 decimal places. -6.67x10 N/m syntax incomplete.arrow_forward
 Holt Mcdougal Larson Pre-algebra: Student Edition...AlgebraISBN:9780547587776Author:HOLT MCDOUGALPublisher:HOLT MCDOUGAL
 Glencoe Algebra 1, Student Edition, 9780079039897...AlgebraISBN:9780079039897Author:CarterPublisher:McGraw Hill
 Big Ideas Math A Bridge To Success Algebra 1: Stu...AlgebraISBN:9781680331141Author:HOUGHTON MIFFLIN HARCOURTPublisher:Houghton Mifflin Harcourt