
Videos
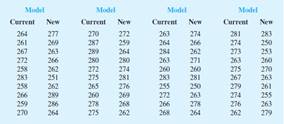
One of the researchers voiced concern about the effect of the new coating on driving distances. Par would like the new cut-resistant ball to offer driving distances comparable to those of the current-model golf ball. To compare the driving distances for the two balls, 40 balls of both the new and current models were subjected to distance tests. The testing was performed with a mechanical hitting machine so that any difference between the
Managerial Report
- 1. Formulate and present the rationale for a hypothesis test that Par could use to compare the driving distances of the current and new golf balls.
- 2. Analyze the data to provide the hypothesis testing conclusion. What is the p-value for your test? What is your recommendation for Par, Inc.?
- 3. Provide
descriptive statistical summaries of the data for each model. - 4. What is the 95% confidence interval for the population mean driving distance of each model, and what is the 95% confidence interval for the difference between the means of the two populations?
- 5. Do you see a need for larger
sample sizes and more testing with the golf balls? Discuss.
1.
State the null and alternative hypothesis.
Answer to Problem 1CP
Null hypothesis:
Alternative hypothesis:
Explanation of Solution
Calculation:
The data represents the results of the tests, with distances measured to the nearest yard for the new model and current model.
Here,
State the hypotheses:
Null hypothesis:
That is, there is no difference between the driving distances of the current and new golf balls.
Alternative hypothesis:
That is, there is a difference between the driving distances of the current and new golf balls.
2.
Find the p-value and provide conclusion.
Answer to Problem 1CP
The p-value is 0.188.
There is sufficient evidence to conclude that, there is no difference between the driving distances of the current and new golf balls.
Explanation of Solution
Calculation:
The test statistic for hypothesis tests about
Software procedure:
Step-by-step software procedure to obtain the confidence interval using MINITAB software is as follows:
- Choose Stat > Basic Statistics > 2 sample t.
- Choose Samples in columns.
- In First column enter Current.
- In Second column enter New.
- Choose Options.
- In Confidence level, enter 95.
- In Alternative, select not equal.
- Click OK in all the dialogue boxes.
Output using MINTAB software is as follows:
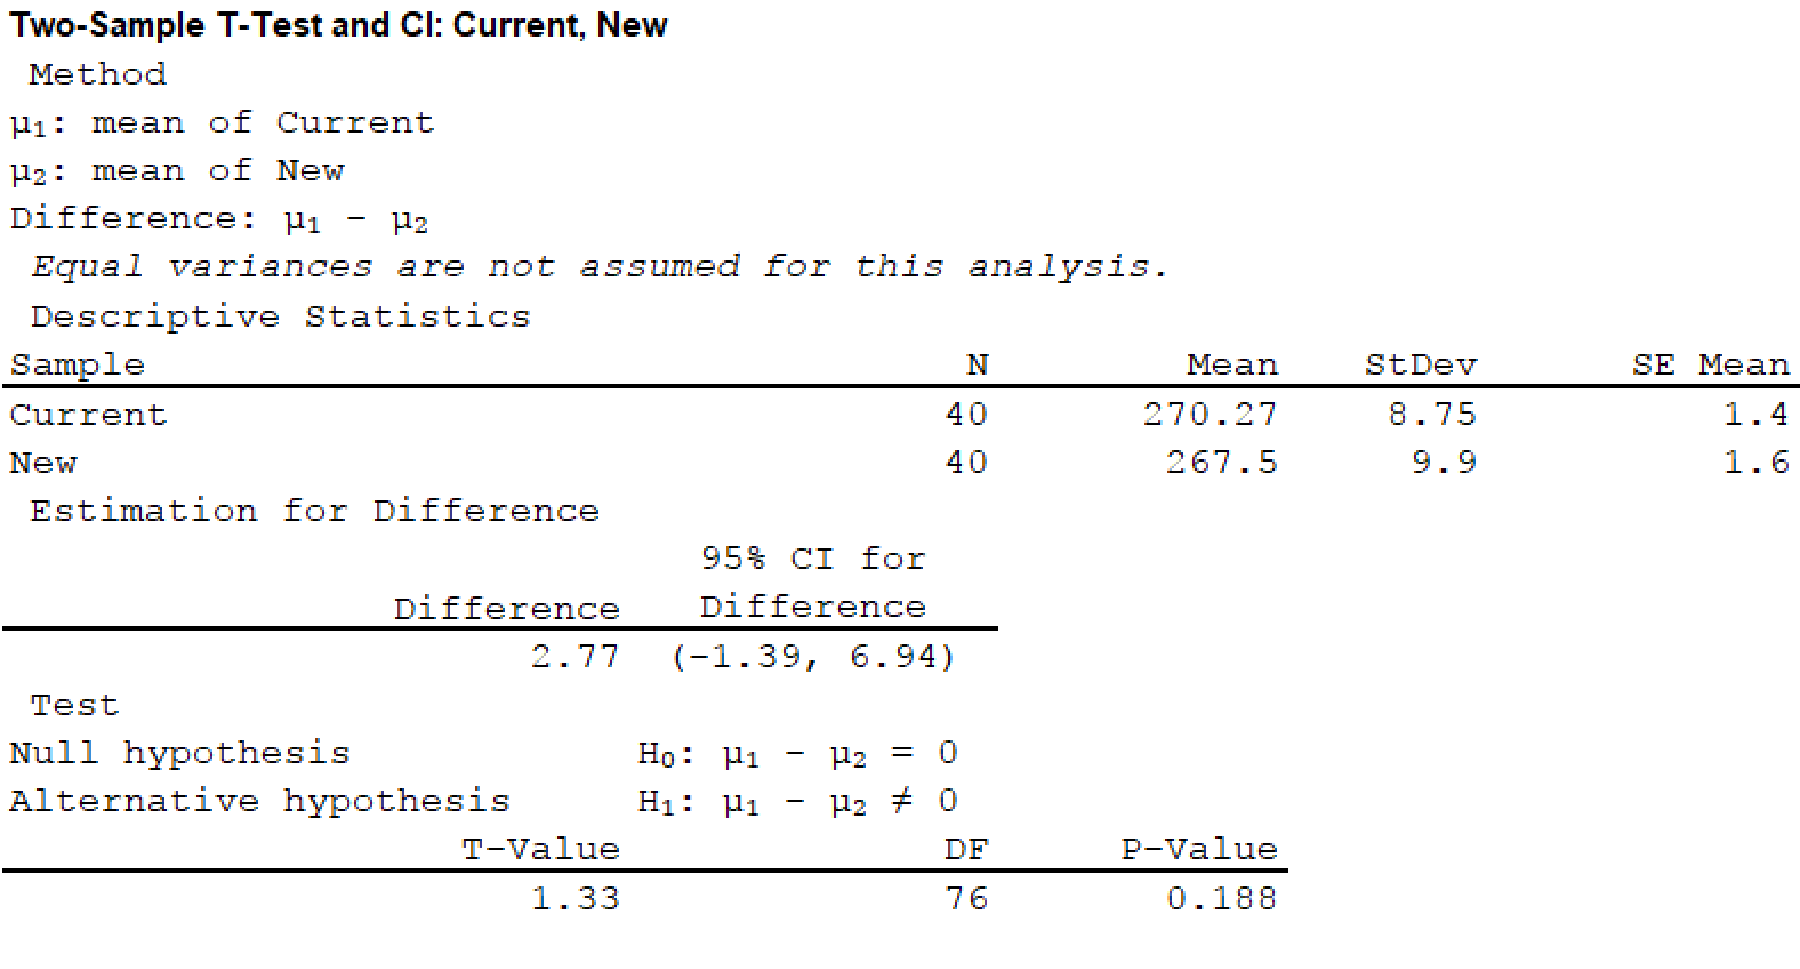
Thus, the test statistic is 1.28 and the p-value is 0.188.
Decision rule based on p-value approach:
If p-value ≤ α, then reject the null hypothesis H0.
If p-value > α, then fail to reject the null hypothesis H0.
Conclusion:
Here, the p-value is 0.188 is greater than the significance level 0.05.
That is,
Thus, the null hypothesis is not rejected.
Therefore, there is sufficient evidence to conclude that, there is no significant difference between the driving distances of the current and new golf balls.
3.
Find the descriptive statistical summaries of the data for each model.
Explanation of Solution
Calculation:
Descriptive statistics for current and new model:
Software procedure:
Step-by-step software procedure to obtain the descriptive statistics using MINITAB software is as follows,
- Choose Stat > Basic Statistics > Display Descriptive Statistics.
- In Variables enter Current and New.
- In Statistics select Mean. SE Mean, StDev, Variance, CoefVar, Q1, Median, Q3, Maximum, IQR.
- Click OK in all the dialogue boxes.
Output using MINITAB software is as follows
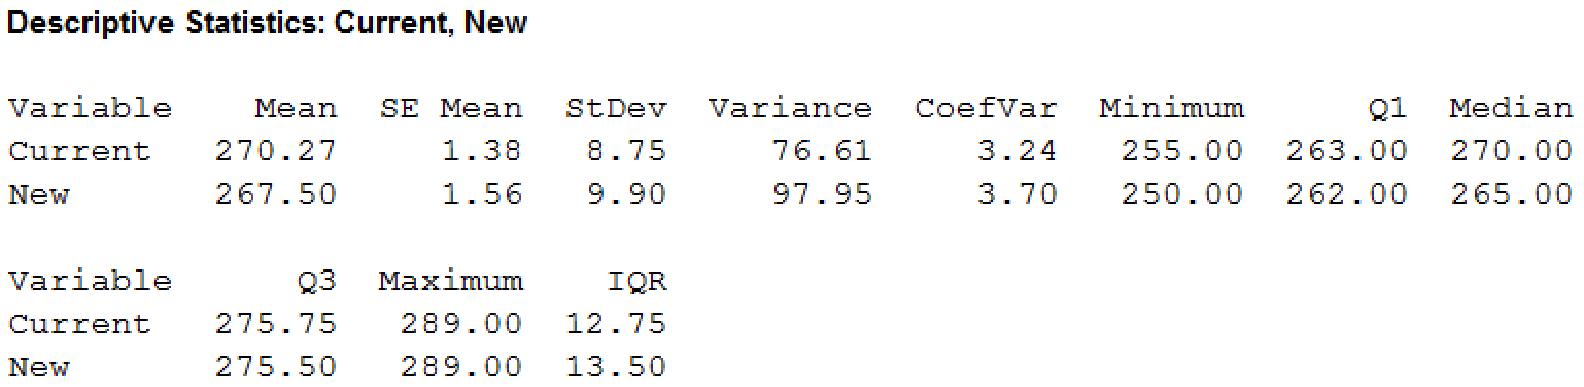
From the output, it can be observed that the mean and median for “current model” is larger than the “new model”. The variance and standard deviation and IQR for “current model” is smaller than “new model”. This indicates that the current model has less variability.
4.
Find the 95% confidence interval for the population mean driving distance of each model.
Find the 95% confidence interval for the difference between the means of the two populations.
Answer to Problem 1CP
The 95% confidence interval for current is
The 95% confidence interval for new is
The 95% confidence interval for the different between the means of the two populations is
Explanation of Solution
Calculation:
Confidence interval for Current:
Software procedure:
Step-by-step software procedure to obtain the confidence interval using MINITAB software is as follows,
- Choose Stat > Basic Statistics > 1 Sample t.
- In Samples in columns enter Current.
- Choose Options.
- In Confidence level, enter 95.
- In Alternative, select not equal.
- Click OK in all the dialogue boxes
Output using MINITAB software is as follows
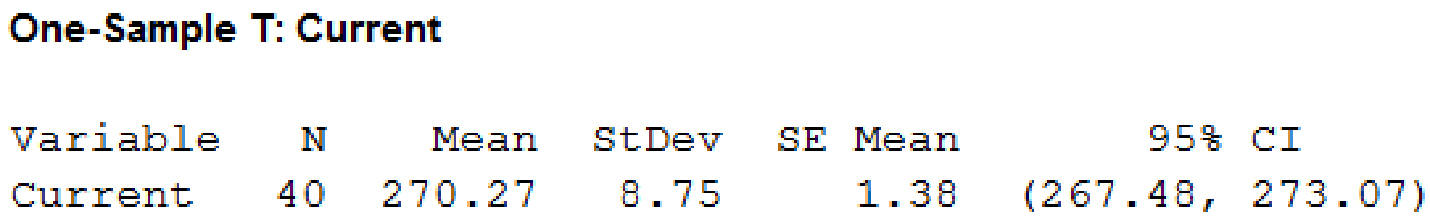
Thus, the 95% confidence interval for current is
Confidence interval for New:
Software procedure:
Step-by-step software procedure to obtain the confidence interval using MINITAB software is as follows,
- Choose Stat > Basic Statistics > 1 Sample t.
- In Samples in columns enter New.
- Choose Options.
- In Confidence level, enter 95.
- In Alternative, select not equal.
- Click OK in all the dialogue boxes
Output using MINITAB software is as follows
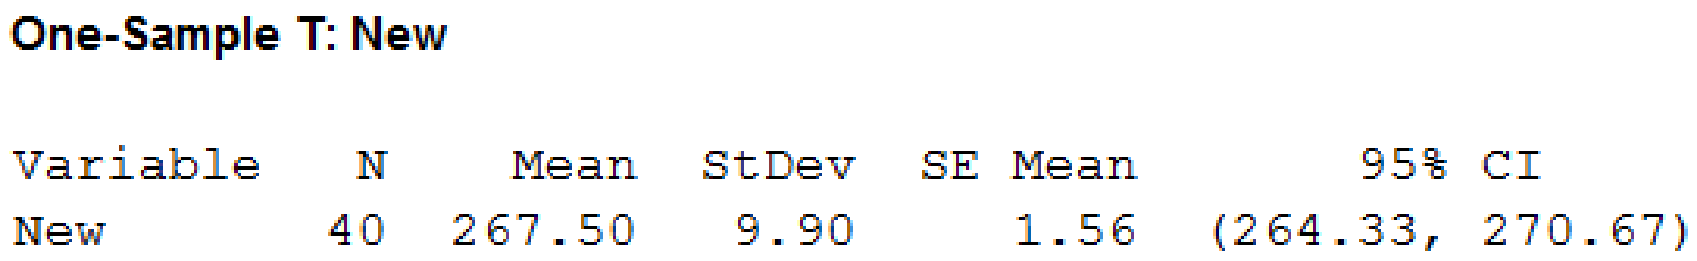
Thus, the 95% confidence interval for new is
Confidence interval for different between the means of the two populations:
Software procedure:
Step-by-step software procedure to obtain the confidence interval using MINITAB software is as follows,
- Choose Stat > Basic Statistics > 2 Sample t.
- Choose Samples in different columns.
- In First enter Current.
- In Second enter New
- Choose Options.
- In Confidence level, enter 95.
- In Alternative, select not equal.
- Click OK in all the dialogue boxes
Output using MINITAB software is as follows
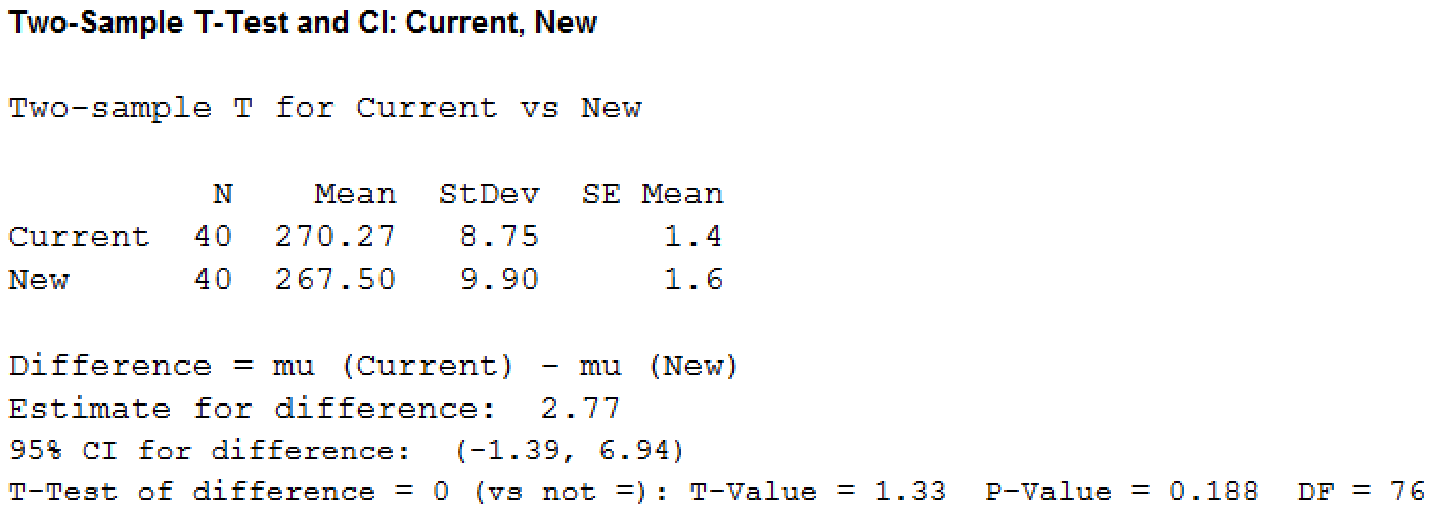
Thus, the 95% confidence interval for the difference between the means of the two populations is
5.
Explain whether there is any need for larger sample sizes and more testing with the golf balls.
Answer to Problem 1CP
No, there is no need for larger sample sizes and there is no need for more testing with the gold balls.
Explanation of Solution
Justification:
From part (2), the null hypothesis not rejected. That is, there is no difference between the driving distances of the current and new golf balls.
Since, the confidence interval for difference between the means of the two populations contains “0” it indicates that there is no difference between the driving distances of the current and new golf balls.
For larger sample size also, the hypotheses test and confidence interval provide the similar results.
Hence, there is need for larger sample sizes and more testing with the golf balls.
Want to see more full solutions like this?
Chapter 10 Solutions
STATISTICS F/BUSINESS+ECONOMICS-TEXT


- 19. Let X be a non-negative random variable. Show that lim nE (IX >n)) = 0. E lim (x)-0. = >arrow_forward(c) Utilize Fubini's Theorem to demonstrate that E(X)= = (1- F(x))dx.arrow_forward(c) Describe the positive and negative parts of a random variable. How is the integral defined for a general random variable using these components?arrow_forward
- 26. (a) Provide an example where X, X but E(X,) does not converge to E(X).arrow_forward(b) Demonstrate that if X and Y are independent, then it follows that E(XY) E(X)E(Y);arrow_forward(d) Under what conditions do we say that a random variable X is integrable, specifically when (i) X is a non-negative random variable and (ii) when X is a general random variable?arrow_forward
 Glencoe Algebra 1, Student Edition, 9780079039897...AlgebraISBN:9780079039897Author:CarterPublisher:McGraw Hill
 Big Ideas Math A Bridge To Success Algebra 1: Stu...AlgebraISBN:9781680331141Author:HOUGHTON MIFFLIN HARCOURTPublisher:Houghton Mifflin Harcourt
 Holt Mcdougal Larson Pre-algebra: Student Edition...AlgebraISBN:9780547587776Author:HOLT MCDOUGALPublisher:HOLT MCDOUGAL
 College Algebra (MindTap Course List)AlgebraISBN:9781305652231Author:R. David Gustafson, Jeff HughesPublisher:Cengage Learning