Videos
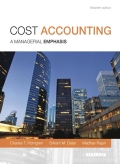
Interpreting regression results, matching time periods. Nandita Summers works at Modus, a store that caters to fashion for young adults. Nandita is responsible for the store’s online advertising and promotion budget. For the past year, she has studied search engine optimization and has been purchasing keywords and display advertising on Google, Facebook, and Twitter. In order to analyze the effectiveness of her efforts and to decide whether to continue online advertising or move her advertising dollars back to traditional print media, Nandita collects the following data:
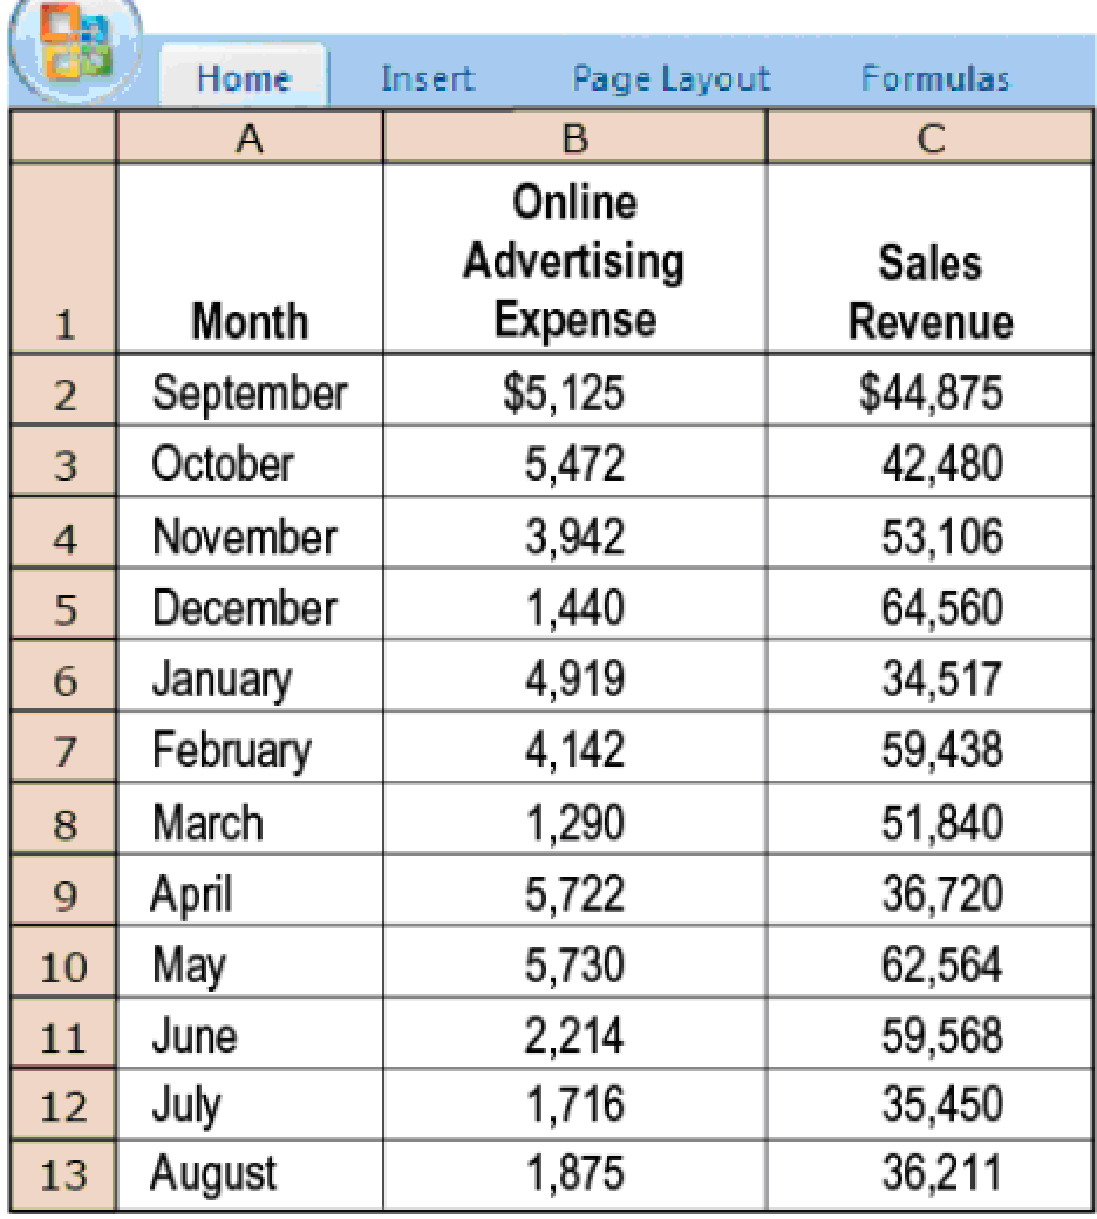
- 1. Nandita performs a regression analysis, comparing each month’s online advertising expense with that month’s revenue. Verify that she obtains the following result:
Required
- 2. Plot the preceding data on a graph and draw the regression line. What does the cost formula indicate about the relationship between monthly online advertising expense and monthly revenues? Is the relationship economically plausible?
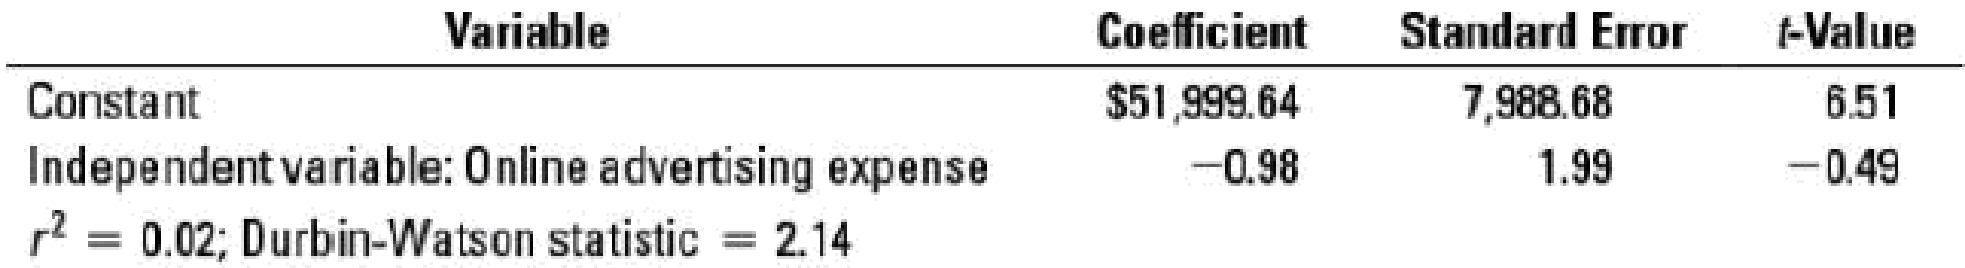
- 3. After further thought, Nandita realizes there may have been a flaw in her approach. In particular, there may be a lag between the time customers click through to the Modus website and peruse its social media content (which is when the online ad expense is incurred) and the time they actually shop in the physical store. Nandita modifies her analysis by comparing each month’s sales revenue to the advertising expense in the prior month. After discarding September revenue and August advertising expense, show that the modified regression yields the following:
- 4. What does the revised formula indicate? Plot the revised data on a graph. Is this relationship economically plausible?
- 5. Can Nandita conclude that there is a cause-and-effect relationship between online advertising expense and sales revenue? Why or why not?
Want to see the full answer?
Check out a sample textbook solution
Chapter 10 Solutions
Cost Accounting


- Please provide the accurate answer to this financial accounting problem using appropriate methods.arrow_forwardI am searching for the accurate solution to this general accounting problem with the right approach.arrow_forwardCan you help me solve this general accounting question using the correct accounting procedures?arrow_forward
- Can you help me solve this general accounting question using the correct accounting procedures?arrow_forwardI need help solving this general accounting question with the proper methodology.arrow_forwardI need the correct answer to this general accounting problem using the standard accounting approach.arrow_forward
 Essentials of Business Analytics (MindTap Course ...StatisticsISBN:9781305627734Author:Jeffrey D. Camm, James J. Cochran, Michael J. Fry, Jeffrey W. Ohlmann, David R. AndersonPublisher:Cengage Learning
 Principles of Accounting Volume 2AccountingISBN:9781947172609Author:OpenStaxPublisher:OpenStax College