Concept explainers
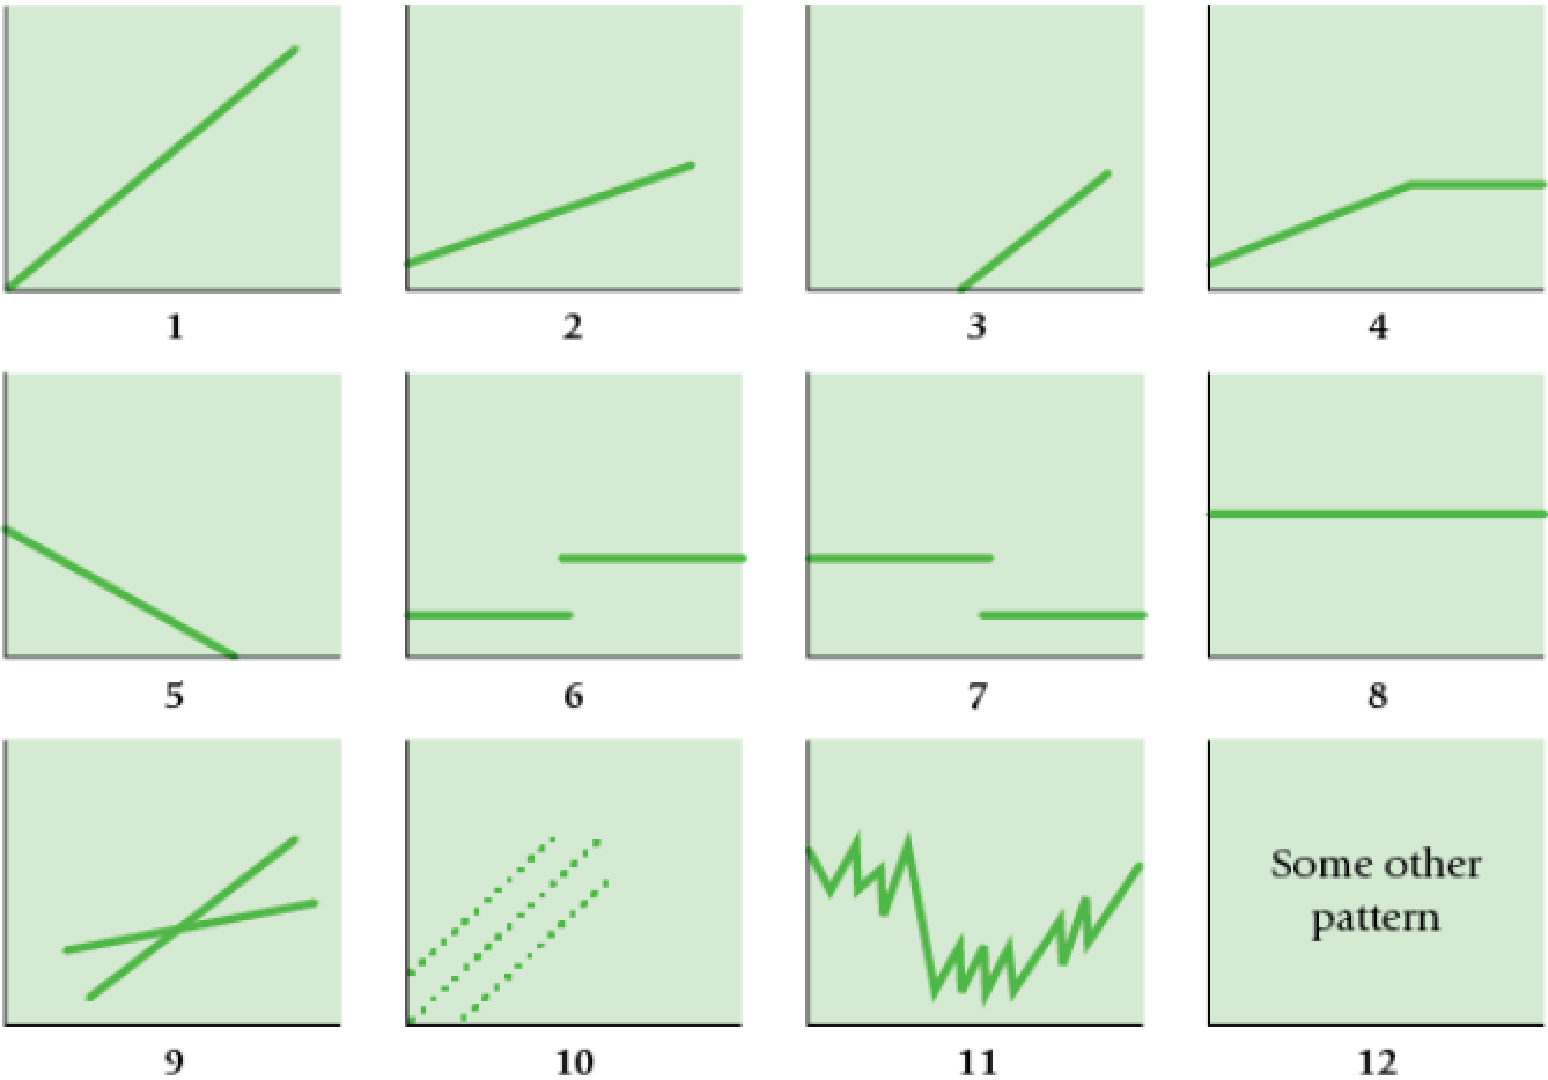
Matching graphs with descriptions of cost and revenue behavior. (D. Green, adapted) Given here are a number of graphs.

The horizontal axis of each graph represents the units produced over the year, and the vertical axis represents total cost or revenues.
Indicate by number which graph best fits the situation or item described (a–h). Some graphs may be used more than once; some may not apply to any of the situations.
Required
- a. Direct material costs
- b. Supervisors’ salaries for one shift and two shifts
- c. A cost–volume–profit graph
- d. Mixed costs—for example, car rental fixed charge plus a rate per mile driven
- e.
Depreciation of plant, computed on a straight-line basis - f. Data supporting the use of a variable-cost rate, such as
manufacturing labor cost of $14 per unit produced - g. Incentive bonus plan that pays managers $0.10 for every unit produced above some level of production
- h. Interest expense on $2 million borrowed at a fixed rate of interest
Learn your wayIncludes step-by-step video

Chapter 10 Solutions
EBK COST ACCOUNTING
Additional Business Textbook Solutions
Financial Accounting (12th Edition) (What's New in Accounting)
Fundamentals of Management (10th Edition)
Financial Accounting, Student Value Edition (5th Edition)
Horngren's Financial & Managerial Accounting, The Financial Chapters (Book & Access Card)
Gitman: Principl Manageri Finance_15 (15th Edition) (What's New in Finance)
- Pls. want Answer of this General Accounting Questionarrow_forwardGeneral Accounting Question Solution with Step by step methodarrow_forwardVal Sims is a self-employed CPA and is the sole practitioner in her tax practice. She has had several situations arise this year involving client representation, client records, and client fee arrangements. Val is concerned that her actions may be in violation of the Circular 230 regulations governing practice before the Internal Revenue Service (IRS). Indicate whether Val is in violation of the regulations for each of the actions described. 1. Howard Corporation's prior-year income tax return was prepared and filed by the company's controller. The return was audited and Howard Corporation paid the additional income taxes assessed by the IRS, including penalties and interest. Although Howard Corporation agreed with income tax assessment, it did not agree with the penalties and interest determined by the IRS. Howard Corporation engaged Val to file a refund claim in connection with the penalties and interest assessed. Val charged the client a fee based on 30 percent of the amount by…arrow_forward
- Need Help with this General Accounting Question Solve with Correct Methodarrow_forwardGeneral Accounting Problem Solve with Correct Methodarrow_forwardComputing Return on Equity In a recent year, Adobe Inc. reports net income of $4,756 million. Its stockholders’ equity is $14,051 million and $14,797 million at the start and end of the fiscal year, respectively. a. Compute its return on equity (ROE) for the year. Round answers to the nearest whole dollar amount. Numerator Denominator Result Return on equity Answer 1 Answer 2 b. Adobe repurchased $6,550 million of its common stock during the year. Did this repurchase increase or decrease ROE? NOTE: Assume there was no change in net income related to the stock repurchase. Answer 3 c. If Adobe had not repurchased common stock during the year, what would ROE have been? Note: Enter answer as a percentage rounded to the nearest one decimal place (ex: 24.8%). Answer 4%arrow_forward
- Val Sims is a self-employed CPA and is the sole practitioner in her tax practice. She has had several situations arise this year involving client representation, client records, and client fee arrangements. Val is concerned that her actions may be in violation of the Circular 230 regulations governing practice before the Internal Revenue Service (IRS). Indicate whether Val is in violation of the regulations for each of the actions described. 1. Andrews, a current business client, is being audited by the IRS. The IRS auditor in charge of the audit has requested that Val provide the depreciation schedules that Val prepared for Andrews's sole proprietorship business. Andrews has refused to provide his copies of the depreciation schedules and has instructed Val not to provide the documents to the auditor. The depreciation schedules are not privileged information. Val provided the requested information to the IRS agent against her client's instructions. 2. In the IRS audit of Val's client…arrow_forwardVal Sims is a self-employed CPA and is the sole practitioner in her tax practice. She has had several situations arise this year involving client representation, client records, and client fee arrangements. Val is concerned that her actions may be in violation of the Circular 230 regulations governing practice before the Internal Revenue Service (IRS). Indicate whether Val is in violation of the regulations for each of the actions described. 1. Val has prepared tax returns and provided tax advice for Charles and Diane, a married couple, for several years. This year, Diane informed her that she and Charles are getting a divorce and asked Val for specific advice as to how she should negotiate an advantageous marital property settlement. Because the divorce was still pending at the end of the year, she also asked Val to prepare their joint income tax return for the year. Val informed Diane that there was a potential conflict of interest and Diane gave informed consent in writing. Val did…arrow_forwardApplying the Accounting Equation and Computing Financing ProportionsUse the accounting equation to compute the missing financial amounts (a), (b), and (c). $ millions Assets = Liabilities + Equity Hewlett-Packard $106,882 = $78,731 + $ (a) General Mills $21,712 = $ (b) + $5,307 Target $ (c) = $27,305 + $12,957 a. Equity: $Answer 1 b. Liabilities: $Answer 2 c. Assets: $Answer 3 Determine the percentage of owner-financing for each company. Company Numerator Denominator % Owner-financed Hewlett-Packard Answer 4 Answer 5 General Mills Answer 6 Answer 7 Target Answer 8 Answer 9 Which of these companies is the most owner-financed? Answer 10Which of these companies is the most nonowner-financed? Answer 11arrow_forward
 Principles of Cost AccountingAccountingISBN:9781305087408Author:Edward J. Vanderbeck, Maria R. MitchellPublisher:Cengage Learning
 Managerial Accounting: The Cornerstone of Busines...AccountingISBN:9781337115773Author:Maryanne M. Mowen, Don R. Hansen, Dan L. HeitgerPublisher:Cengage Learning
 Managerial AccountingAccountingISBN:9781337912020Author:Carl Warren, Ph.d. Cma William B. TaylerPublisher:South-Western College Pub
 Financial And Managerial AccountingAccountingISBN:9781337902663Author:WARREN, Carl S.Publisher:Cengage Learning,
 Financial & Managerial AccountingAccountingISBN:9781285866307Author:Carl Warren, James M. Reeve, Jonathan DuchacPublisher:Cengage Learning
 Excel Applications for Accounting PrinciplesAccountingISBN:9781111581565Author:Gaylord N. SmithPublisher:Cengage Learning


