Cost Accounting, Student Value Edition Plus MyAccountingLab with Pearson eText -- Access Card Package (15th Edition)
15th Edition
ISBN: 9780133781106
Author: Charles T. Horngren, Srikant M. Datar, Madhav V. Rajan
Publisher: PEARSON
expand_more
expand_more
format_list_bulleted
Concept explainers
Textbook Question
Chapter 10, Problem 10.18E
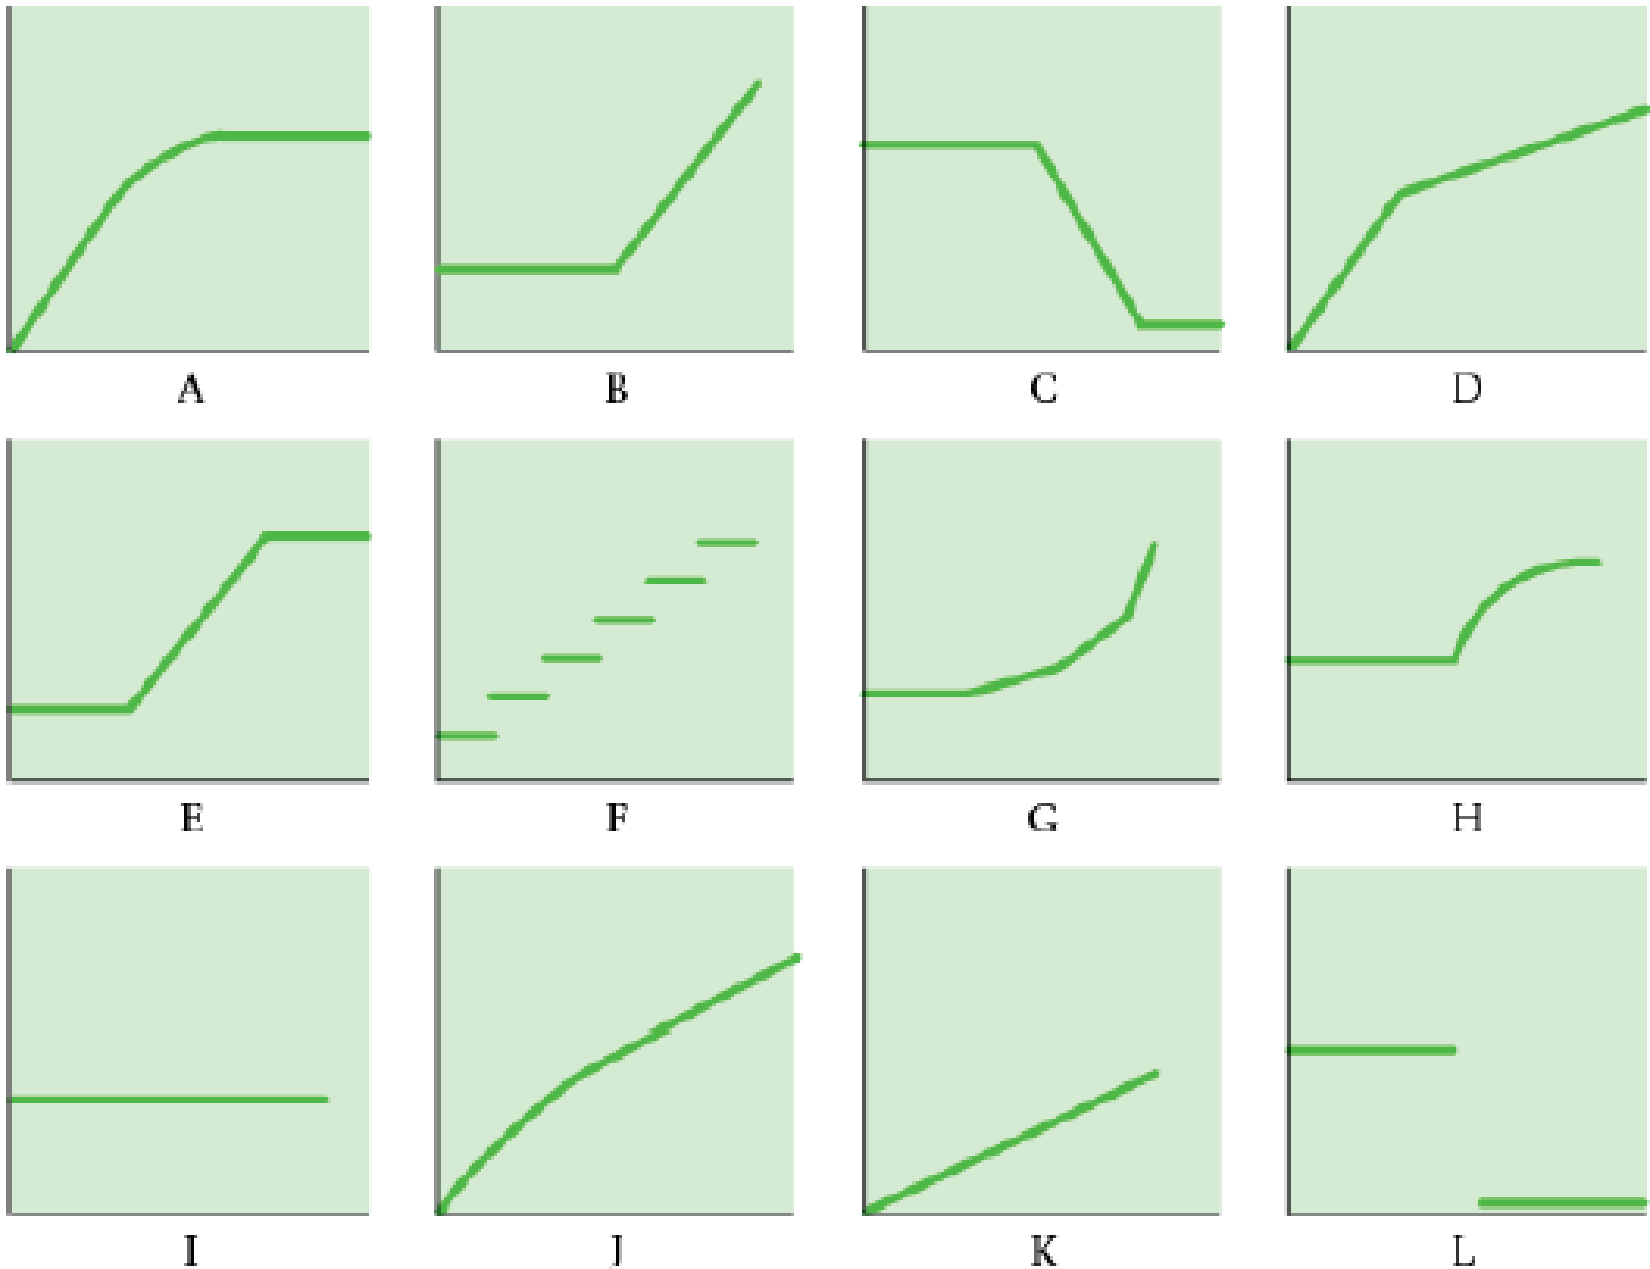
Various cost-behavior patterns. (CPA, adapted).
The vertical axes of the graphs below represent total cost, and the horizontal axes represent units produced during a calendar year. In each case, the zero point of dollars and production is at the intersection of the two axes.

Select the graph that matches the numbered
Required
- 1. Annual
depreciation of equipment where the amount of depreciation charged is computed by the machine-hours method. - 2. Electricity bill—a flat fixed charge, plus a variable cost after a certain number of kilowatt-hours are used, in which the quantity of kilowatt-hours used varies proportionately with quantity of units produced.
- 3. City water bill, which is computed as follows:
| First 1,000,000 gallons or less | $1,000 flat fee |
| Next 10,000 gallons | $0.003 per gallon used |
| Next 10,000 gallons | $0.006 per gallon used |
| Next 10,000 gallons | $0.009 per gallon used |
| and so on | and so on |
The gallons of water used vary proportionately with the quantity of production output.
- 4. Cost of direct materials, where direct material cost per unit produced decreases with each pound of material used (for example, if 1 pound is used, the cost is $10; if 2 pounds are used, the cost is $19.98; if 3 pounds are used, the cost is $29.94), with a minimum cost per unit of $9.20.
- 5. Annual depreciation of equipment, where the amount is computed by the straight-line method. When the depreciation schedule was prepared, it was anticipated that the obsolescence factor would be greater than the wear-and-tear factor.
- 6. Rent on a manufacturing plant donated by the city, where the agreement calls for a fixed-fee payment unless 200,000 labor-hours are worked, in which case no rent is paid.
- 7. Salaries of repair personnel, where one person is needed for every 1,000 machine-hours or less (that is, 0 to 1,000 hours requires one person, 1,001 to 2,000 hours requires two people, and so on).
- 8. Cost of direct materials used (assume no quantity discounts).
- 9. Rent on a manufacturing plant donated by the county, where the agreement calls for rent of $100,000 to be reduced by $1 for each direct manufacturing labor-hour worked in excess of 200,000 hours, but a minimum rental fee of $20,000 must be paid.
Expert Solution & Answer
Want to see the full answer?
Check out a sample textbook solution
Students have asked these similar questions
wick X
> Student Portal | UAG x A Week 3 - Learning Ac x
> Question 5 - Week 3
X
G On January 1, 2024, S X
C On January 1, 2021, S X
ezto.mheducation.com/ext/map/index.html?_con=con&external_browser=0&launchUrl=https%253A%252F%252Flms.mheducation.com%252Fmghmiddlew
aged bookmarks
SNCC Resources
ACS SIR CP
Changepoint > Concur > Footprints
Smart.ly
> Medrisk ClaimExpert S Juris Verint - Sch
ek 3-Learning Activity i
Saved
5
oints
eBook
Print
References
On January 1, 2024, Sledge had common stock of $150,000 and retained earnings of $290,000. During that year, Sledge reported
sales of $160,000, cost of goods sold of $85,000, and operating expenses of $43,000.
On January 1, 2022, Percy, Incorporated, acquired 90 percent of Sledge's outstanding voting stock. At that date, $63,000 of the
acquisition-date fair value was assigned to unrecorded contracts (with a 20-year life) and $23,000 to an undervalued building (with a
10-year remaining life).
In 2023, Sledge sold inventory costing $10,800…
help me with this general accounting question
The financial statements of Greenfield
Inc. reported net sales of $600,000 and
accounts receivable of $40,000 at the
beginning of the year and $45,000 at the
end of the year.
What is the receivables turnover ratio for
Greenfield Inc.?
Chapter 10 Solutions
Cost Accounting, Student Value Edition Plus MyAccountingLab with Pearson eText -- Access Card Package (15th Edition)
Ch. 10 - What two assumptions are frequently made when...Ch. 10 - Describe three alternative linear cost functions.Ch. 10 - What is the difference between a linear and a...Ch. 10 - High correlation between two variables means that...Ch. 10 - Name four approaches to estimating a cost...Ch. 10 - Describe the conference method for estimating a...Ch. 10 - Describe the account analysis method for...Ch. 10 - List the six steps in estimating a cost function...Ch. 10 - When using the high-low method, should you base...Ch. 10 - Describe three criteria for evaluating cost...
Ch. 10 - Define learning curve. Outline two models that can...Ch. 10 - Discuss four frequently encountered problems when...Ch. 10 - Prob. 10.13QCh. 10 - All the independent variables in a cost function...Ch. 10 - Multicollinearity exists when the dependent...Ch. 10 - Prob. 10.16ECh. 10 - Prob. 10.17ECh. 10 - Various cost-behavior patterns. (CPA, adapted)....Ch. 10 - Matching graphs with descriptions of cost and...Ch. 10 - Prob. 10.20ECh. 10 - Prob. 10.21ECh. 10 - Prob. 10.22ECh. 10 - Prob. 10.23ECh. 10 - Prob. 10.24ECh. 10 - Prob. 10.25ECh. 10 - Prob. 10.26ECh. 10 - Prob. 10.27ECh. 10 - Learning curve, cumulative average-time learning...Ch. 10 - Learning curve, incremental unit-time learning...Ch. 10 - Prob. 10.30ECh. 10 - Prob. 10.31PCh. 10 - Prob. 10.32PCh. 10 - Prob. 10.33PCh. 10 - Interpreting regression results. Spirit...Ch. 10 - Prob. 10.35PCh. 10 - Prob. 10.36PCh. 10 - Regression; choosing among models. Apollo Hospital...Ch. 10 - Multiple regression (continuation of 10-42). After...Ch. 10 - Prob. 10.39PCh. 10 - Prob. 10.40PCh. 10 - Interpreting regression results, matching time...Ch. 10 - Prob. 10.42PCh. 10 - Prob. 10.43P
Knowledge Booster
Learn more about
Need a deep-dive on the concept behind this application? Look no further. Learn more about this topic, accounting and related others by exploring similar questions and additional content below.Similar questions
- Selected hypothetical comparative statement data for the giant bookseller Barnes & Noble are presented here. All balance sheet data are as of the end of the fiscal year (in millions). 2025 2024 Net sales $5,150.4 $5,100.2 Cost of goods sold 3,000.0 3,700.6 Net income 75.2 190.9 Accounts receivable (net) 65.0 102.2 Inventory 1,250.1 1,350.1 Total assets 2,950.1 3,250.1 Total common stockholders' equity 920.4 1,070.2 Compute the following ratios for 2025. (Round asset turnover to 2 decimal places, e.g 1.83 and all other answers to 1 decimal place, e.g. 1.8 or 2.5%) a. Profit margin b. Asset turnover C. Return on assets d. Return on common stockholders' equity e. Gross profit rate 90.8 % times % do % do % doarrow_forward2025 2024 Cash $14,000 $28,000 Accounts receivable (net) 80,000 51,000 Inventory 58,000 48,000 Plant assets (net) 235,000 220,000 $387,000 $347,000 Accounts payable $51,500 $58,000 Bonds payable (15%) 125,000 125,000 Common stock, $10 par 160,000 124,000 Retained earnings 50,500 40,000 $387,000 $347,000 Additional information for 2025: 1. Net income was $23,500. 2. Sales on account were $370,000. Sales returns and allowances amounted to $27,000. 3. Cost of goods sold was $206,000. 4. Net cash provided by operating activities was $46,000. 5. Capital expenditures were $20,000, and cash dividends paid were $13,000. 6. The bonds payable are due in 2038. Compute the following ratios at December 31, 2025. (Round current ratio and inventory turnover to 2 decimal places, e.g. 1.83 and all other answers to 1 decimal place, e.g. 1.8. Use 365 days for calculation.) a. Current ratio b. Accounts receivable turnover C. Average collection period d. Inventory turnover e. Days in inventory f. Free cash…arrow_forwardThe financial statements of Greenfield Inc. reported net sales of $600,000 and accounts receivable of $40,000 at the beginning of the year and $45,000 at the end of the year. What is the receivables turnover ratio for Greenfield Inc.?arrow_forward
- An income statement would not include O dividends paid. ○ discontinued operations. other revenue and gains. O income from operations.arrow_forwardAssume the following sales data for a company: 2026 $978000 2025 873200 2024 740000 If 2024 is the base year, what is the percentage increase in sales from 2024 to 2025? 18% 132% 118% ○ 32%arrow_forwardD company has an investment in trading securities of $139000. The fair value of the investment declined during the current year resulting in an unrealized loss of $6950. Assuming a 35% tax rate, the effect of this loss on other comprehensive income will be $90350 decrease. O no effect. O $139000 increase. ○ $48650 decrease.arrow_forward
- Sunland Corporation reported the following: Year 1 sales $720 Year 2 sales $840 Year 3 sales $900 What is the percentage to be assigned for Year 3 using horizontal analysis? ○ 117%. 80%. 125%. ○ 107%.arrow_forwardI want to this question answer for General accounting question not need ai solutionarrow_forwardAn income statement would not include O dividends paid. ○ discontinued operations. other revenue and gains. O income from operations.arrow_forward
- Ayayai Corporation reported net sales of $680000, $841100, and $911200 in the years 2024, 2025, and 2026, respectively. If 2024 is the base year, what percentage do 2026 sales represent of the base? 134% 108% 75% 34%arrow_forwardWhen a company compares each item in the asset section to total assets, the type of analysis being used is vertical analysis. differential analysis. O horizontal analysis. O trend analysis.arrow_forwardHello tutor please given General accounting question answer do fast and properly explain all answerarrow_forward
arrow_back_ios
SEE MORE QUESTIONS
arrow_forward_ios
Recommended textbooks for you
 Principles of Cost AccountingAccountingISBN:9781305087408Author:Edward J. Vanderbeck, Maria R. MitchellPublisher:Cengage Learning
 Managerial Accounting: The Cornerstone of Busines...AccountingISBN:9781337115773Author:Maryanne M. Mowen, Don R. Hansen, Dan L. HeitgerPublisher:Cengage Learning
 Managerial AccountingAccountingISBN:9781337912020Author:Carl Warren, Ph.d. Cma William B. TaylerPublisher:South-Western College Pub

Principles of Cost Accounting
Accounting
ISBN:9781305087408
Author:Edward J. Vanderbeck, Maria R. Mitchell
Publisher:Cengage Learning

Managerial Accounting: The Cornerstone of Busines...
Accounting
ISBN:9781337115773
Author:Maryanne M. Mowen, Don R. Hansen, Dan L. Heitger
Publisher:Cengage Learning

Managerial Accounting
Accounting
ISBN:9781337912020
Author:Carl Warren, Ph.d. Cma William B. Tayler
Publisher:South-Western College Pub
What is variance analysis?; Author: Corporate finance institute;https://www.youtube.com/watch?v=SMTa1lZu7Qw;License: Standard YouTube License, CC-BY