
Concept explainers
Videos
In Exercises 1−4. (a) identify the claim and state H0 and Ha, (b) find the critical value and identify the rejection region, (c) find the chi-square test statistic, (d) decide whether to reject or fail to reject the null hypothesis, and (e) interpret the decision in the context of the original claim.
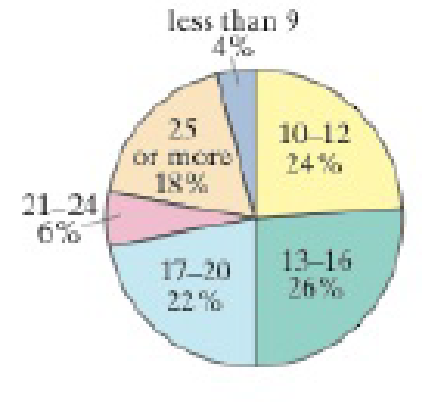
1. A researcher claims that the distribution of the lengths of visits at physician offices is different from the distribution shown in the pie chart. You randomly select 400 people and ask them how long their office visits with a physician were. The table shows the results. At a = 0.01, test the researcher’s claim, (Adapted from Medscape)
| Survey results | |
| Minutes | Frequence, f |
| less than 9 | 20 |
| 10−12 | 80 |
| 13−16 | 113 |
| 17−20 | 91 |
| 21−24 | 40 |
| 25 or more | 56 |
a.
To identify: The claim.
To state: The hypothesis
Answer to Problem 10.1.1RE
The claim is that, the distribution of the lengths differs from the expected distribution.
The hypothesis
Explanation of Solution
Given info:
The data shows the results of the distribution of the lengths of the visits at physician offices.
Calculation:
Here, the distribution of the lengths differs from the expected distribution is tested. Hence, the claim is that the distribution of the lengths differs from the expected distribution.
The hypotheses are given below:
Null hypothesis:
Alternative hypothesis:
b.
To obtain: The critical value.
To identify: The rejection region.
Answer to Problem 10.1.1RE
The critical value is 15.086.
The rejection region is
Explanation of Solution
Given info:
The level of significance is 0.01.
Calculation:
Critical value:
The critical value is calculated by using the
Substitute k as 6 in degrees of freedom.
From the Table 6-Chi-Square Distribution, the critical value for 5 degrees of freedom for
Rejection region:
The null hypothesis would be rejected if
Thus, the rejection region is
c.
To obtain: The chi-square test statistic.
Answer to Problem 10.1.1RE
The chi-square test statistic is 18.770.
Explanation of Solution
Calculation:
Step by step procedure to obtain chi-square test statistic using the MINITAB software:
- Choose Stat > Tables > Chi-Square Goodness-of-Fit Test (One Variable).
- In Observed counts, enter the column of Frequency.
- In Category names, enter the column of Minutes.
- Under Test, select the column of Proportions in Proportions specified by historical counts.
- Click OK.
Output using the MINITAB software is given below:
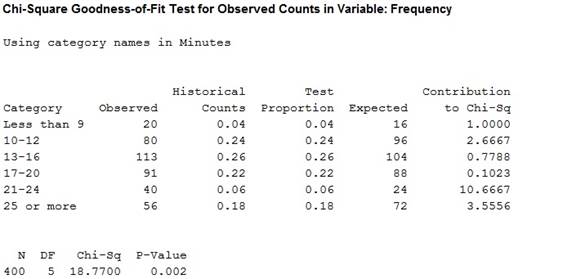
Thus, the chi-square test statistic value is approximately 18.770.
d.
To check: Whether the null hypothesis is rejected or fails to reject.
Answer to Problem 10.1.1RE
The null hypothesis is rejected.
Explanation of Solution
Conclusion:
From the result of (c), the test-statistic value is 18.770.
Here, the chi-square test statistic value is greater than the critical value.
That is,
Thus, it can be conclude that the null hypothesis is rejected.
e.
To interpret: The decision in the context of the original claim.
Answer to Problem 10.1.1RE
The conclusion is that, there is evidence to support the claim that the distribution of the lengths differs from the expected distribution.
Explanation of Solution
Interpretation:
From the results of part (d), it can be conclude that there is evidence to support the claim that the distribution of the lengths differs from the expected distribution.
Want to see more full solutions like this?
Chapter 10 Solutions
Elementary Statistics: Picturing the World Books a la carte Plus MyLab Statistics with Pearson eText -- Access Card Package (7th Edition)


- Consider the hypothesis test Ho: = 622 against H₁: 6 > 62. Suppose that the sample sizes are n₁ = 20 and n₂ = 8, and that = 4.5; s=2.3. Use a = 0.01. (a) Test the hypothesis. Round your answers to two decimal places (e.g. 98.76). The test statistic is fo = i The critical value is f = Conclusion: i the null hypothesis at a = 0.01. (b) Construct the confidence interval on 02/022 which can be used to test the hypothesis: (Round your answer to two decimal places (e.g. 98.76).) iarrow_forward2011 listing by carmax of the ages and prices of various corollas in a ceratin regionarrow_forwardس 11/ أ . اذا كانت 1 + x) = 2 x 3 + 2 x 2 + x) هي متعددة حدود محسوبة باستخدام طريقة الفروقات المنتهية (finite differences) من جدول البيانات التالي للدالة (f(x . احسب قيمة . ( 2 درجة ) xi k=0 k=1 k=2 k=3 0 3 1 2 2 2 3 αarrow_forward
- 1. Differentiate between discrete and continuous random variables, providing examples for each type. 2. Consider a discrete random variable representing the number of patients visiting a clinic each day. The probabilities for the number of visits are as follows: 0 visits: P(0) = 0.2 1 visit: P(1) = 0.3 2 visits: P(2) = 0.5 Using this information, calculate the expected value (mean) of the number of patient visits per day. Show all your workings clearly. Rubric to follow Definition of Random variables ( clearly and accurately differentiate between discrete and continuous random variables with appropriate examples for each) Identification of discrete random variable (correctly identifies "number of patient visits" as a discrete random variable and explains reasoning clearly.) Calculation of probabilities (uses the probabilities correctly in the calculation, showing all steps clearly and logically) Expected value calculation (calculate the expected value (mean)…arrow_forwardif the b coloumn of a z table disappeared what would be used to determine b column probabilitiesarrow_forwardConstruct a model of population flow between metropolitan and nonmetropolitan areas of a given country, given that their respective populations in 2015 were 263 million and 45 million. The probabilities are given by the following matrix. (from) (to) metro nonmetro 0.99 0.02 metro 0.01 0.98 nonmetro Predict the population distributions of metropolitan and nonmetropolitan areas for the years 2016 through 2020 (in millions, to four decimal places). (Let x, through x5 represent the years 2016 through 2020, respectively.) x₁ = x2 X3 261.27 46.73 11 259.59 48.41 11 257.96 50.04 11 256.39 51.61 11 tarrow_forward
- If the average price of a new one family home is $246,300 with a standard deviation of $15,000 find the minimum and maximum prices of the houses that a contractor will build to satisfy 88% of the market valuearrow_forward21. ANALYSIS OF LAST DIGITS Heights of statistics students were obtained by the author as part of an experiment conducted for class. The last digits of those heights are listed below. Construct a frequency distribution with 10 classes. Based on the distribution, do the heights appear to be reported or actually measured? Does there appear to be a gap in the frequencies and, if so, how might that gap be explained? What do you know about the accuracy of the results? 3 4 555 0 0 0 0 0 0 0 0 0 1 1 23 3 5 5 5 5 5 5 5 5 5 5 5 5 6 6 8 8 8 9arrow_forwardA side view of a recycling bin lid is diagramed below where two panels come together at a right angle. 45 in 24 in Width? — Given this information, how wide is the recycling bin in inches?arrow_forward
- 1 No. 2 3 4 Binomial Prob. X n P Answer 5 6 4 7 8 9 10 12345678 8 3 4 2 2552 10 0.7 0.233 0.3 0.132 7 0.6 0.290 20 0.02 0.053 150 1000 0.15 0.035 8 7 10 0.7 0.383 11 9 3 5 0.3 0.132 12 10 4 7 0.6 0.290 13 Poisson Probability 14 X lambda Answer 18 4 19 20 21 22 23 9 15 16 17 3 1234567829 3 2 0.180 2 1.5 0.251 12 10 0.095 5 3 0.101 7 4 0.060 3 2 0.180 2 1.5 0.251 24 10 12 10 0.095arrow_forwardstep by step on Microssoft on how to put this in excel and the answers please Find binomial probability if: x = 8, n = 10, p = 0.7 x= 3, n=5, p = 0.3 x = 4, n=7, p = 0.6 Quality Control: A factory produces light bulbs with a 2% defect rate. If a random sample of 20 bulbs is tested, what is the probability that exactly 2 bulbs are defective? (hint: p=2% or 0.02; x =2, n=20; use the same logic for the following problems) Marketing Campaign: A marketing company sends out 1,000 promotional emails. The probability of any email being opened is 0.15. What is the probability that exactly 150 emails will be opened? (hint: total emails or n=1000, x =150) Customer Satisfaction: A survey shows that 70% of customers are satisfied with a new product. Out of 10 randomly selected customers, what is the probability that at least 8 are satisfied? (hint: One of the keyword in this question is “at least 8”, it is not “exactly 8”, the correct formula for this should be = 1- (binom.dist(7, 10, 0.7,…arrow_forwardKate, Luke, Mary and Nancy are sharing a cake. The cake had previously been divided into four slices (s1, s2, s3 and s4). What is an example of fair division of the cake S1 S2 S3 S4 Kate $4.00 $6.00 $6.00 $4.00 Luke $5.30 $5.00 $5.25 $5.45 Mary $4.25 $4.50 $3.50 $3.75 Nancy $6.00 $4.00 $4.00 $6.00arrow_forward
 College Algebra (MindTap Course List)AlgebraISBN:9781305652231Author:R. David Gustafson, Jeff HughesPublisher:Cengage Learning
 Glencoe Algebra 1, Student Edition, 9780079039897...AlgebraISBN:9780079039897Author:CarterPublisher:McGraw Hill
 Holt Mcdougal Larson Pre-algebra: Student Edition...AlgebraISBN:9780547587776Author:HOLT MCDOUGALPublisher:HOLT MCDOUGAL
 Big Ideas Math A Bridge To Success Algebra 1: Stu...AlgebraISBN:9781680331141Author:HOUGHTON MIFFLIN HARCOURTPublisher:Houghton Mifflin Harcourt