
Concept explainers
Videos
Scared Straight The idea of sending delinquents to “Scared Straight” programs has appeared recently in several media programs (such as Dr. Phil) and on a program called Beyond Scared Straight. So it seems appropriate to look at a randomized experiment from the past. In 1983, Roy Lewis reported on a study in California. Each male delinquent in the study (all were aged 14-18) was randomly assigned to either Scared Straight or no treatment. The males who were assigned to Scared Straight went to a prison, where they heard prisoners talk about their bad experiences there. Then the males in both the experimental and the control group were observed for 12 months to see whether they were rearrested. The table shows the results. (Source: Lewis, “Scared straight—California style: Evaluation of the San Quentin Squires program,” Criminal Justice and Behavior, vol. 10 [June 1983]: 209-226)
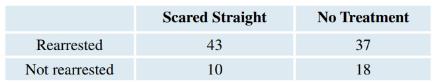
a. Report the rearrest rate for the Scared Straight group and for the No Treatment group, and state which is higher.
b. This experiment was done in the hope of showing that Scared Straight would cause a lower arrest rate. Did the study show that? Explain.

Trending nowThis is a popular solution!

Chapter 1 Solutions
INTRODUCTORY STAT. W/MYLAB MATH>CUSTOM<
Additional Math Textbook Solutions
Elementary & Intermediate Algebra
Elementary Statistics: Picturing the World (7th Edition)
Basic College Mathematics
Introductory Statistics
College Algebra (Collegiate Math)
Elementary Statistics ( 3rd International Edition ) Isbn:9781260092561


- A company found that the daily sales revenue of its flagship product follows a normal distribution with a mean of $4500 and a standard deviation of $450. The company defines a "high-sales day" that is, any day with sales exceeding $4800. please provide a step by step on how to get the answers in excel Q: What percentage of days can the company expect to have "high-sales days" or sales greater than $4800? Q: What is the sales revenue threshold for the bottom 10% of days? (please note that 10% refers to the probability/area under bell curve towards the lower tail of bell curve) Provide answers in the yellow cellsarrow_forwardFind the critical value for a left-tailed test using the F distribution with a 0.025, degrees of freedom in the numerator=12, and degrees of freedom in the denominator = 50. A portion of the table of critical values of the F-distribution is provided. Click the icon to view the partial table of critical values of the F-distribution. What is the critical value? (Round to two decimal places as needed.)arrow_forwardA retail store manager claims that the average daily sales of the store are $1,500. You aim to test whether the actual average daily sales differ significantly from this claimed value. You can provide your answer by inserting a text box and the answer must include: Null hypothesis, Alternative hypothesis, Show answer (output table/summary table), and Conclusion based on the P value. Showing the calculation is a must. If calculation is missing,so please provide a step by step on the answers Numerical answers in the yellow cellsarrow_forward
 College Algebra (MindTap Course List)AlgebraISBN:9781305652231Author:R. David Gustafson, Jeff HughesPublisher:Cengage Learning
 Glencoe Algebra 1, Student Edition, 9780079039897...AlgebraISBN:9780079039897Author:CarterPublisher:McGraw Hill
 Holt Mcdougal Larson Pre-algebra: Student Edition...AlgebraISBN:9780547587776Author:HOLT MCDOUGALPublisher:HOLT MCDOUGAL