
Data Analytics For Accounting
19th Edition
ISBN: 9781260375190
Author: RICHARDSON, Vernon J., Teeter, Ryan, Terrell, Katie
Publisher: Mcgraw-hill Education,
expand_more
expand_more
format_list_bulleted
Question
Chapter 1, Problem 4P
To determine
Do an Excel PivotTable according to state and find out the number of rejected applications for each state. Reorder the numbers and draw a graph ordering the states and the number of rejected loans from highest to lowest. Identify whether there exist any variations among states.
Expert Solution & Answer
Explanation of Solution
The number of rejected applications for each state is as follows:
| Row Labels | Count of Loan Title |
| CA | 99,792 |
| TX | 62,049 |
| NY | 60,718 |
| FL | 60,051 |
| PA | 33,167 |
| IL | 31,488 |
| GA | 29,000 |
| OH | 28,510 |
| NJ | 27,666 |
| VA | 23,556 |
| MI | 20,696 |
| NC | 20,386 |
| MA | 18,808 |
| MD | 17,856 |
| AZ | 16,281 |
| MO | 14,605 |
| WA | 14,007 |
| CO | 13,335 |
| AL | 13,185 |
| SC | 12,146 |
| CT | 12,137 |
| LA | 11,181 |
| WI | 10,664 |
| MN | 10,400 |
| KY | 10,286 |
| NV | 9,513 |
| 9,400 | |
| OK | 8,165 |
| OR | 7,198 |
| KS | 6,336 |
| UT | 5,126 |
| WV | 4,975 |
| HI | 4,341 |
| NM | 4,329 |
| NH | 4,038 |
| RI | 3,637 |
| DE | 2,708 |
| MT | 2,102 |
| AK | 2,005 |
| DC | 1,900 |
| VT | 1,829 |
| SD | 1,620 |
| WY | 1,608 |
| IN | 1,134 |
| MS | 551 |
| TN | 449 |
| NE | 175 |
| IA | 144 |
| ME | 108 |
| ID | 69 |
| ND | 38 |
| (blank) | 21 |
| Grand Total | 755,489 |
The graph ordering the states and the number of rejected loans from highest to lowest:
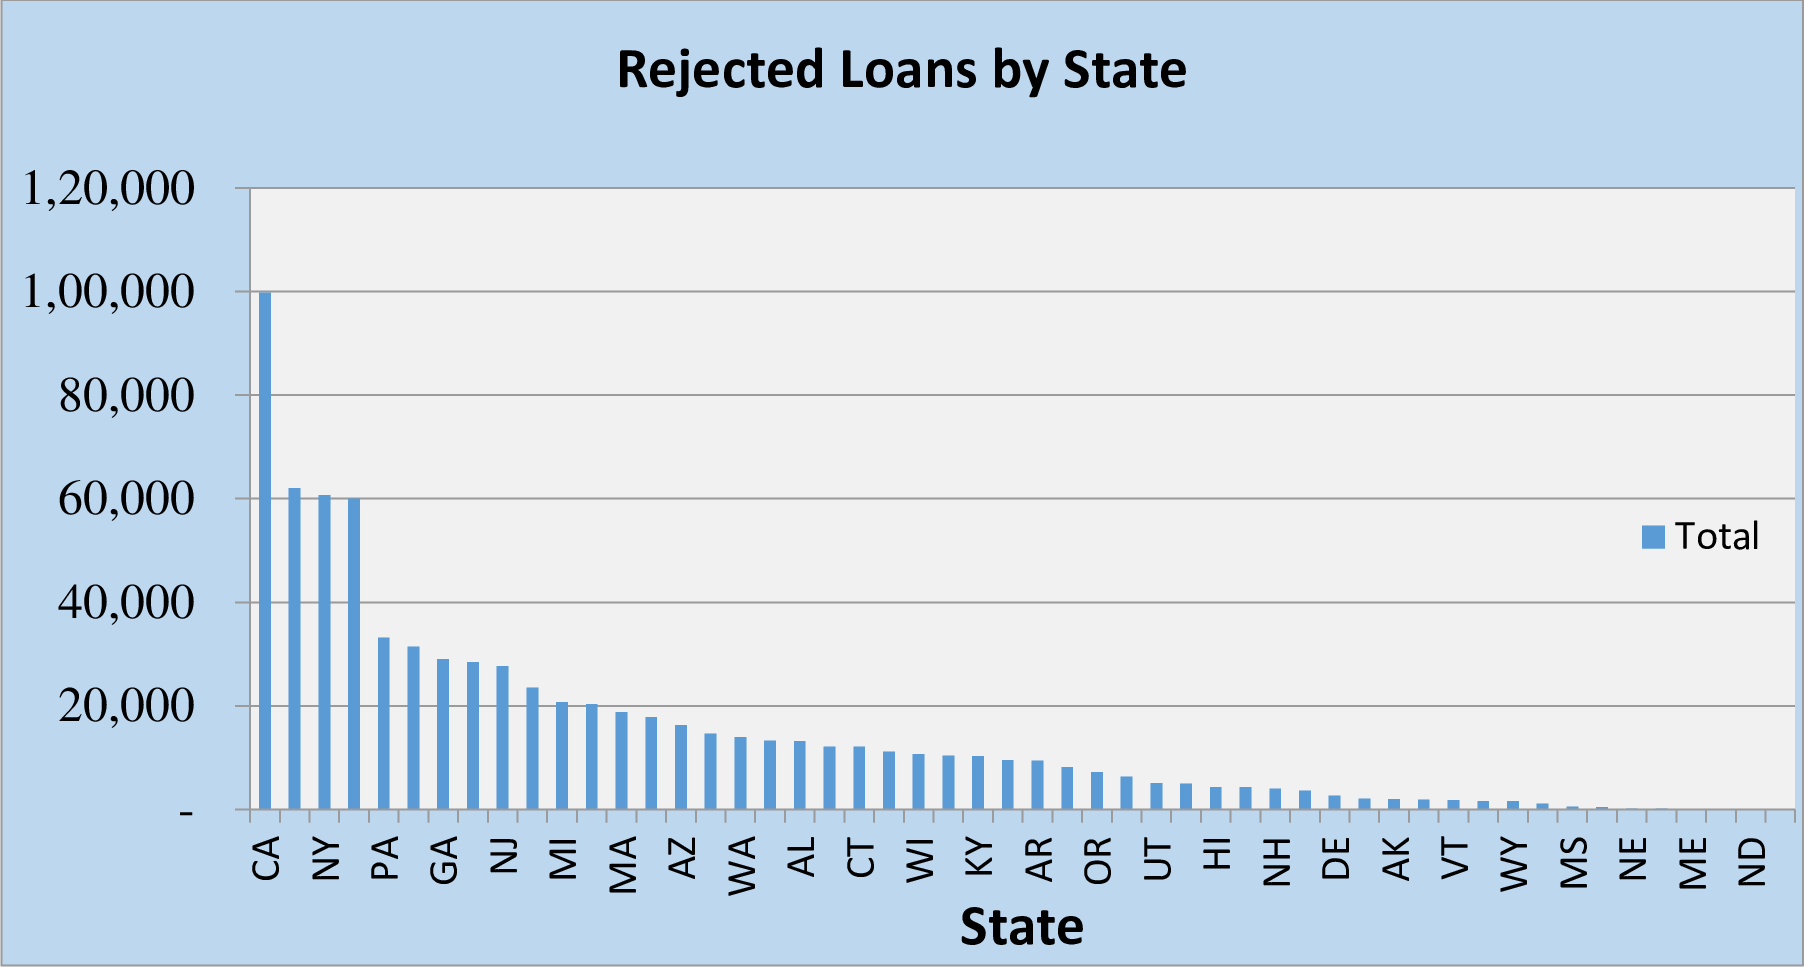
There is a varaibility among the number of loans rejected in a particular state and the population of that state. The number of rejected loans varies in a different manner.
Want to see more full solutions like this?
Subscribe now to access step-by-step solutions to millions of textbook problems written by subject matter experts!
Students have asked these similar questions
Please show me the correct approach to solving this financial accounting question with proper techniques.
What amount of gain does he have to report on this sale?
What was the direct labor cost variance?
Chapter 1 Solutions
Data Analytics For Accounting
Ch. 1 - Prob. 1MCQCh. 1 - Prob. 2MCQCh. 1 - Prob. 3MCQCh. 1 - Prob. 4MCQCh. 1 - Prob. 5MCQCh. 1 - Prob. 6MCQCh. 1 - Prob. 7MCQCh. 1 - Prob. 8MCQCh. 1 - Prob. 9MCQCh. 1 - Prob. 10MCQ
Ch. 1 - Prob. 1DQCh. 1 - Give an example of how Data Analytics creates...Ch. 1 - Prob. 3DQCh. 1 - Prob. 4DQCh. 1 - Prob. 5DQCh. 1 - Prob. 6DQCh. 1 - Prob. 7DQCh. 1 - Prob. 8DQCh. 1 - Prob. 9DQCh. 1 - Prob. 10DQCh. 1 - Prob. 11DQCh. 1 - Prob. 12DQCh. 1 - To address the question Will I receive a loan from...Ch. 1 - Download and consider the data dictionary file...Ch. 1 - Download and consider the rejected loans dataset...Ch. 1 - Prob. 3PCh. 1 - Prob. 4PCh. 1 - Consider the 2013 declined loan data from...Ch. 1 - Consider the 2013 declined loan data from...
Knowledge Booster

Similar questions
- Paramount Company uses a standard costing system that allows 2.5 pounds of direct materials for one finished unit. During August, the company purchased 35,000 pounds of direct materials for $175,000 and manufactured 13,200 finished units. The standard direct materials cost allowed for the units manufactured is $132,000. The performance report shows that Paramount has an unfavorable direct materials usage variance of $6,400. Also, the company records any price variance for materials at time of purchase. The number of pounds of direct materials used to produce August's output was__ pounds.arrow_forwardWhat is Nicholas's taxable income?arrow_forwardGrantwell Corp. had the following information at December 31:arrow_forward
- Portland Pottery Inc. budgeted production of 78,500 vases for the year. Each vase requires glazing. Assume that 9 minutes are required to glaze each vase. If glazing labor costs $16.75 per hour, determine the direct labor cost budget for the year.arrow_forwardCalculate the cost of goods sold for the yeararrow_forwardVermont Electronics uses a predetermined overhead rate based on machine hours to apply manufacturing overhead to jobs. The company estimated manufacturing overhead at $427,500 for the year and machine hours at 95,000.Actual manufacturing overhead costs incurred during the year totaled $438,600. Actual machine hours were 98,500. What was the overapplied or underapplied overhead for the year?arrow_forward
arrow_back_ios
SEE MORE QUESTIONS
arrow_forward_ios
Recommended textbooks for you
 Essentials Of Business AnalyticsStatisticsISBN:9781285187273Author:Camm, Jeff.Publisher:Cengage Learning,
Essentials Of Business Analytics
Statistics
ISBN:9781285187273
Author:Camm, Jeff.
Publisher:Cengage Learning,