Videos
CASE STUDY Chrysalises for Cash
The butterfly symbolizes the notion of personal change. Increasingly, people are turning to butterflies to consecrate meaningful
Due to the possibility of introducing an invasive species, butterfly suppliers are monitored by governmental agencies. Along with following regulations, butterfly suppliers must ensure quality and quantity of their product while maintaining a profit. To this end, an individual supplier may hire independent contractors to hatch the varieties needed. These entrepreneurs are paid a small fee for each chrysalis delivered, with a 50% bonus added for each hatched healthy butterfly. This fee structure provides little room for profit. Therefore, it is important that these contractors deliver a high proportion of healthy butterflies that emerge at a fairly predictable rate.
In Florida, one such entrepreneur specializes in harvesting the black swallowtail butterfly. In nature, the female butterfly seeks plants, such as carrot and parsley, to harvest and lay eggs on. A newly hatched caterpillar consumes the host plant, then secures itself and sheds its skin, revealing a chrysalis. During this resting phase, environmental factors such as temperature and humidity may affect the transformation process. Typically, the black swallowtail takes about 1 week to complete its metamorphosis and emerge from its chrysalis. The transformation occasionally results in deformities
The Florida contractor believes that there are differences in quality and emergence time among his broods. Not having taken a scientific approach to the problem, he relies on his memory of seasons past. It seems to him that late-season butterflies emerge sooner and with a greater number of deformities than their early-season counterparts. He also speculates that the type and nutritional value of the food consumed by the caterpillar might contribute to any observed differences. This year he is committed to a more formal approach to his butterfly harvest.
Since it takes 2 days to deliver the chrysalises from the contractor to the supplier, it is important that the butterflies do not emerge prematurely. It is equally important that the number of defective butterflies be minimized. With these two goals in mind, the contractor seeks the best combination of food source, fertilizer, and brood season to maximize his profits. To examine the effects of these variables on emergence time and number of deformed butterflies, the entrepreneur designed the following experiment.
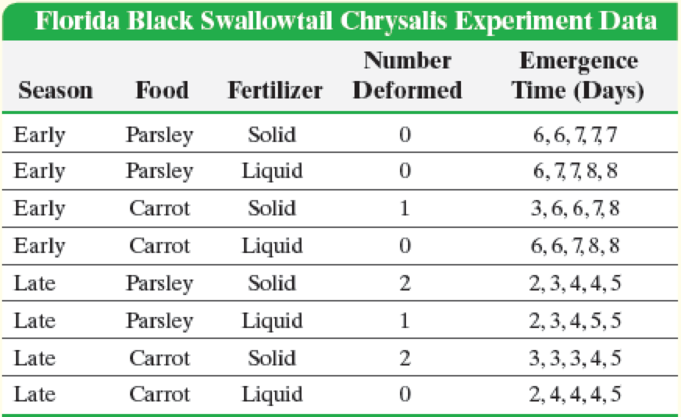
Eight identical pots were filled with equal amounts of a soil and watered carefully to ensure consistency. Two pots of carrot plants and two of parsley were set outside during the early part of the brood season. For the carrot pair, one pot was fed a fixed amount of liquid fertilizer, while the other was fed a nutritionally similar amount of solid fertilizer. The two pots of parsley were similarly fertilized. All four pots were placed next to each other to ensure similar exposures to environmental conditions such as temperature and solar radiation. Five black swallowtail caterpillars of similar age were placed into each container, each allowed to mature and form a chrysalis. The time from chrysalis formation until emergence was reported to the nearest day, along with any defects. The same procedure was followed with the four pots that were placed outdoors during the late brood season.
Write a report describing the experimental goals and design for the entrepreneur’s experiment. Follow the procedure outlined in the box on steps in designing and conducting an experiment (p. 44). Step 5(b), of this procedure is provided in the following table and should be included in your report.
In your report, provide a general descriptive analysis of these data. Be sure to include recommendations for the combination of season, food source, and type of fertilizer that result in the fewest deformed butterflies while achieving a long emergence time. Conclude your report with recommendations for further experiments. For each proposed experiment, be sure to do the following:
4. State the treatment.
Want to see the full answer?
Check out a sample textbook solution
Chapter 1 Solutions
Fundamentals of Statistics - With MyStatLab


- 5. Probability Distributions – Continuous Random Variables A factory machine produces metal rods whose lengths (in cm) follow a continuous uniform distribution on the interval [98, 102]. Questions: a) Define the probability density function (PDF) of the rod length.b) Calculate the probability that a randomly selected rod is shorter than 99 cm.c) Determine the expected value and variance of rod lengths.d) If a sample of 25 rods is selected, what is the probability that their average length is between 99.5 cm and 100.5 cm? Justify your answer using the appropriate distribution.arrow_forward2. Hypothesis Testing - Two Sample Means A nutritionist is investigating the effect of two different diet programs, A and B, on weight loss. Two independent samples of adults were randomly assigned to each diet for 12 weeks. The weight losses (in kg) are normally distributed. Sample A: n = 35, 4.8, s = 1.2 Sample B: n=40, 4.3, 8 = 1.0 Questions: a) State the null and alternative hypotheses to test whether there is a significant difference in mean weight loss between the two diet programs. b) Perform a hypothesis test at the 5% significance level and interpret the result. c) Compute a 95% confidence interval for the difference in means and interpret it. d) Discuss assumptions of this test and explain how violations of these assumptions could impact the results.arrow_forward1. Sampling Distribution and the Central Limit Theorem A company produces batteries with a mean lifetime of 300 hours and a standard deviation of 50 hours. The lifetimes are not normally distributed—they are right-skewed due to some batteries lasting unusually long. Suppose a quality control analyst selects a random sample of 64 batteries from a large production batch. Questions: a) Explain whether the distribution of sample means will be approximately normal. Justify your answer using the Central Limit Theorem. b) Compute the mean and standard deviation of the sampling distribution of the sample mean. c) What is the probability that the sample mean lifetime of the 64 batteries exceeds 310 hours? d) Discuss how the sample size affects the shape and variability of the sampling distribution.arrow_forward
- A biologist is investigating the effect of potential plant hormones by treating 20 stem segments. At the end of the observation period he computes the following length averages: Compound X = 1.18 Compound Y = 1.17 Based on these mean values he concludes that there are no treatment differences. 1) Are you satisfied with his conclusion? Why or why not? 2) If he asked you for help in analyzing these data, what statistical method would you suggest that he use to come to a meaningful conclusion about his data and why? 3) Are there any other questions you would ask him regarding his experiment, data collection, and analysis methods?arrow_forwardBusinessarrow_forwardWhat is the solution and answer to question?arrow_forward
- To: [Boss's Name] From: Nathaniel D Sain Date: 4/5/2025 Subject: Decision Analysis for Business Scenario Introduction to the Business Scenario Our delivery services business has been experiencing steady growth, leading to an increased demand for faster and more efficient deliveries. To meet this demand, we must decide on the best strategy to expand our fleet. The three possible alternatives under consideration are purchasing new delivery vehicles, leasing vehicles, or partnering with third-party drivers. The decision must account for various external factors, including fuel price fluctuations, demand stability, and competition growth, which we categorize as the states of nature. Each alternative presents unique advantages and challenges, and our goal is to select the most viable option using a structured decision-making approach. Alternatives and States of Nature The three alternatives for fleet expansion were chosen based on their cost implications, operational efficiency, and…arrow_forwardBusinessarrow_forwardWhy researchers are interested in describing measures of the center and measures of variation of a data set?arrow_forward
- WHAT IS THE SOLUTION?arrow_forwardThe following ordered data list shows the data speeds for cell phones used by a telephone company at an airport: A. Calculate the Measures of Central Tendency from the ungrouped data list. B. Group the data in an appropriate frequency table. C. Calculate the Measures of Central Tendency using the table in point B. 0.8 1.4 1.8 1.9 3.2 3.6 4.5 4.5 4.6 6.2 6.5 7.7 7.9 9.9 10.2 10.3 10.9 11.1 11.1 11.6 11.8 12.0 13.1 13.5 13.7 14.1 14.2 14.7 15.0 15.1 15.5 15.8 16.0 17.5 18.2 20.2 21.1 21.5 22.2 22.4 23.1 24.5 25.7 28.5 34.6 38.5 43.0 55.6 71.3 77.8arrow_forwardII Consider the following data matrix X: X1 X2 0.5 0.4 0.2 0.5 0.5 0.5 10.3 10 10.1 10.4 10.1 10.5 What will the resulting clusters be when using the k-Means method with k = 2. In your own words, explain why this result is indeed expected, i.e. why this clustering minimises the ESS map.arrow_forward

 Glencoe Algebra 1, Student Edition, 9780079039897...AlgebraISBN:9780079039897Author:CarterPublisher:McGraw Hill
 Algebra: Structure And Method, Book 1AlgebraISBN:9780395977224Author:Richard G. Brown, Mary P. Dolciani, Robert H. Sorgenfrey, William L. ColePublisher:McDougal Littell
 Algebra & Trigonometry with Analytic GeometryAlgebraISBN:9781133382119Author:SwokowskiPublisher:Cengage
 Holt Mcdougal Larson Pre-algebra: Student Edition...AlgebraISBN:9780547587776Author:HOLT MCDOUGALPublisher:HOLT MCDOUGAL
 Trigonometry (MindTap Course List)TrigonometryISBN:9781337278461Author:Ron LarsonPublisher:Cengage Learning