
Sub part (a):
The possible combination of consumption of two goods.
Sub part (a):
Explanation of Solution
The consumption bundle of two goods can be calculated by using the following formula.
Substitute the respective values in equation (1) to calculate the number of peanut bags purchased while consuming 0 units of candy bars.
When the person consumes 0 quantities of candy bars, then he can purchase 10 units of peanut bags.
Table -1 shows the possible quantity of candy bars and peanut bags with the given level of income that is obtained by using equation (1).
Table -1
| Goods/Combination | 1 | 2 | 3 | 4 | 5 | 6 |
| Candy bars | 0 | 4 | 8 | 12 | 16 | 20 |
| Bags of peanuts | 10 | 8 | 6 | 4 | 2 | 0 |
Concept introduction:
Budget constraint: Budget constraints define the possible bundles of services and commodities that are purchased at a given price level with the entire income.
Sub part b:
The possible combination of consumption of two goods.
Sub part b:
Explanation of Solution
The diagram below shows the possible combination of two goods that can be purchased with the limited income. It is drawn based on the values given in the Table -1.
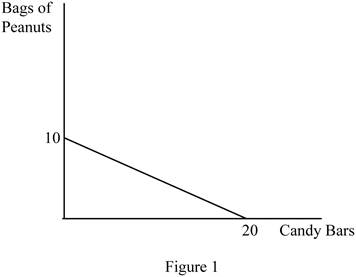
In Figure 1, the horizontal axis measures the quantity of candy bars and the vertical axis measures the quantity of peanut bags. The downward slope indicates the budget line.
The slope can be calculated as follows.
Thus, the slope of this budget line is -0.5.
Opportunity cost (OP) of obtaining one more candy bar can be calculated as follows.
In the calculation of opportunity cost, the sign can be ignored. Thus, the opportunity cost of getting one more candy bar is 0.5.
The opportunity cost (OP) of obtaining one more peanut bag can be calculated as follows.
In the calculation of opportunity cost, the sign can be ignored. The opportunity cost of getting one more candy bar is 2. The opportunity costs are constant over the possible combination of bundles since the slope of the budget line remains the same over different points in the budget line.
Concept introduction:
Budget constraint: Budget constraints define the possible bundles of services and commodities that are purchased at a given price level with the entire income.
Opportunity cost: Opportunity cost refers to the benefits given up in the process of obtaining some other benefit.
Sub part (c):
The possible combination of consumption of two goods.
Sub part (c):
Explanation of Solution
The budget line shows only the possible combination of goods and services that can be purchased simultaneously within the given income level. Thus, it does not determine the optimum quantity of two goods.
Concept introduction:
Budget constraint: Budget constraints define the possible bundles of services and commodities that are purchased at a given price level with the entire income.
Opportunity cost: Opportunity cost refers to the benefits given up in the process of obtaining some other benefit.
Sub part (d):
The possible combination of consumption of two goods.
Sub part (d):
Explanation of Solution
Table -2 shows the possible quantity of candy bars and peanut bags with the increased level of income that is obtained by using equation (1).
Table -2
| Goods/ Combination | 1 | 2 |
| Candy bars | 0 | 40 |
| Bags of peanuts | 20 | 0 |
The diagram below shows the possible combination of two goods that can be purchased with a limited income. It is drawn based on the values given in Table -2.
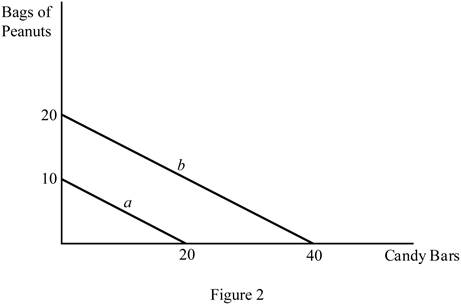
In Figure 2, the horizontal axis measures the quantity of the candy bar and the vertical axis measures the peanut bags. The downward slope (a) indicates the budget line with a $15 income, and the downward slope (b) indicates the budget line with a $30 income. Increasing the level of the income shifts the budget line to the right side.
Concept introduction:
Budget constraint: Budget constraints define the possible bundles of services and commodities that are purchased at a given price level with the entire income.
Opportunity cost: Opportunity cost refers to the benefits given up in the process of obtaining some other benefit.
Want to see more full solutions like this?
Chapter 1 Solutions
Microeconomics

- Answerarrow_forwardM” method Given the following model, solve by the method of “M”. (see image)arrow_forwardAs indicated in the attached image, U.S. earnings for high- and low-skill workers as measured by educational attainment began diverging in the 1980s. The remaining questions in this problem set use the model for the labor market developed in class to walk through potential explanations for this trend. 1. Assume that there are just two types of workers, low- and high-skill. As a result, there are two labor markets: supply and demand for low-skill workers and supply and demand for high-skill workers. Using two carefully drawn labor-market figures, show that an increase in the demand for high skill workers can explain an increase in the relative wage of high-skill workers. 2. Using the same assumptions as in the previous question, use two carefully drawn labor-market figures to show that an increase in the supply of low-skill workers can explain an increase in the relative wage of high-skill workers.arrow_forward
- Published in 1980, the book Free to Choose discusses how economists Milton Friedman and Rose Friedman proposed a one-sided view of the benefits of a voucher system. However, there are other economists who disagree about the potential effects of a voucher system.arrow_forwardThe following diagram illustrates the demand and marginal revenue curves facing a monopoly in an industry with no economies or diseconomies of scale. In the short and long run, MC = ATC. a. Calculate the values of profit, consumer surplus, and deadweight loss, and illustrate these on the graph. b. Repeat the calculations in part a, but now assume the monopoly is able to practice perfect price discrimination.arrow_forwardThe projects under the 'Build, Build, Build' program: how these projects improve connectivity and ease of doing business in the Philippines?arrow_forward


 Principles of Economics 2eEconomicsISBN:9781947172364Author:Steven A. Greenlaw; David ShapiroPublisher:OpenStax
 Principles of Economics (MindTap Course List)EconomicsISBN:9781305585126Author:N. Gregory MankiwPublisher:Cengage Learning
 Principles of Economics, 7th Edition (MindTap Cou...EconomicsISBN:9781285165875Author:N. Gregory MankiwPublisher:Cengage Learning