
Sub part (a):
The possible combination of consumption of two goods.
Sub part (a):
Explanation of Solution
The consumption bundle of two goods can be calculated by using the following formula.
Substitute the respective values in equation (1) to calculate the number of peanut bags purchased while consuming 0 units of candy bars.
When the person consumes 0 quantities of candy bars, then he can purchase 10 units of peanut bags.
Table -1 shows the possible quantity of candy bars and peanut bags with the given level of income that is obtained by using equation (1).
Table -1
| Goods/Combination | 1 | 2 | 3 | 4 | 5 | 6 |
| Candy bars | 0 | 4 | 8 | 12 | 16 | 20 |
| Bags of peanuts | 10 | 8 | 6 | 4 | 2 | 0 |
Concept introduction:
Budget constraint: Budget constraints define the possible bundles of services and commodities that are purchased at a given price level with the entire income.
Sub part b:
The possible combination of consumption of two goods.
Sub part b:
Explanation of Solution
The diagram below shows the possible combination of two goods that can be purchased with the limited income. It is drawn based on the values given in the Table -1.
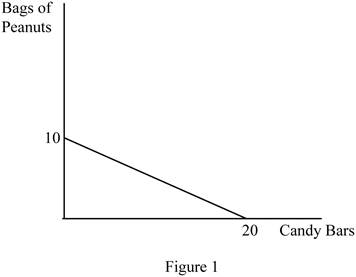
In Figure 1, the horizontal axis measures the quantity of candy bars and the vertical axis measures the quantity of peanut bags. The downward slope indicates the budget line.
The slope can be calculated as follows.
Thus, the slope of this budget line is -0.5.
Opportunity cost (OP) of obtaining one more candy bar can be calculated as follows.
In the calculation of opportunity cost, the sign can be ignored. Thus, the opportunity cost of getting one more candy bar is 0.5.
The opportunity cost (OP) of obtaining one more peanut bag can be calculated as follows.
In the calculation of opportunity cost, the sign can be ignored. The opportunity cost of getting one more candy bar is 2. The opportunity costs are constant over the possible combination of bundles since the slope of the budget line remains the same over different points in the budget line.
Concept introduction:
Budget constraint: Budget constraints define the possible bundles of services and commodities that are purchased at a given price level with the entire income.
Opportunity cost: Opportunity cost refers to the benefits given up in the process of obtaining some other benefit.
Sub part (c):
The possible combination of consumption of two goods.
Sub part (c):
Explanation of Solution
The budget line shows only the possible combination of goods and services that can be purchased simultaneously within the given income level. Thus, it does not determine the optimum quantity of two goods.
Concept introduction:
Budget constraint: Budget constraints define the possible bundles of services and commodities that are purchased at a given price level with the entire income.
Opportunity cost: Opportunity cost refers to the benefits given up in the process of obtaining some other benefit.
Sub part (d):
The possible combination of consumption of two goods.
Sub part (d):
Explanation of Solution
Table -2 shows the possible quantity of candy bars and peanut bags with the increased level of income that is obtained by using equation (1).
Table -2
| Goods/ Combination | 1 | 2 |
| Candy bars | 0 | 40 |
| Bags of peanuts | 20 | 0 |
The diagram below shows the possible combination of two goods that can be purchased with a limited income. It is drawn based on the values given in Table -2.
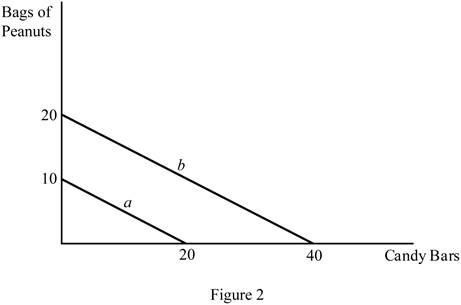
In Figure 2, the horizontal axis measures the quantity of the candy bar and the vertical axis measures the peanut bags. The downward slope (a) indicates the budget line with a $15 income, and the downward slope (b) indicates the budget line with a $30 income. Increasing the level of the income shifts the budget line to the right side.
Concept introduction:
Budget constraint: Budget constraints define the possible bundles of services and commodities that are purchased at a given price level with the entire income.
Opportunity cost: Opportunity cost refers to the benefits given up in the process of obtaining some other benefit.
Want to see more full solutions like this?
Chapter 1 Solutions
Macroeconomics

- You are the manager of a large automobile dealership who wants to learn more about the effective- ness of various discounts offered to customers over the past 14 months. Following are the average negotiated prices for each month and the quantities sold of a basic model (adjusted for various options) over this period of time. 1. Graph this information on a scatter plot. Estimate the demand equation. What do the regression results indicate about the desirability of discounting the price? Explain. Month Price Quantity Jan. 12,500 15 Feb. 12,200 17 Mar. 11,900 16 Apr. 12,000 18 May 11,800 20 June 12,500 18 July 11,700 22 Aug. 12,100 15 Sept. 11,400 22 Oct. 11,400 25 Nov. 11,200 24 Dec. 11,000 30 Jan. 10,800 25 Feb. 10,000 28 2. What other factors besides price might be included in this equation? Do you foresee any difficulty in obtaining these additional data or incorporating them in the regression analysis?arrow_forwardsimple steps on how it should look like on excelarrow_forwardConsider options on a stock that does not pay dividends.The stock price is $100 per share, and the risk-free interest rate is 10%.Thestock moves randomly with u=1.25and d=1/u Use Excel to calculate the premium of a10-year call with a strike of $100.arrow_forward
- Please solve this, no words or explanations.arrow_forward17. Given that C=$700+0.8Y, I=$300, G=$600, what is Y if Y=C+I+G?arrow_forwardUse the Feynman technique throughout. Assume that you’re explaining the answer to someone who doesn’t know the topic at all. Write explanation in paragraphs and if you use currency use USD currency: 10. What is the mechanism or process that allows the expenditure multiplier to “work” in theKeynesian Cross Model? Explain and show both mathematically and graphically. What isthe underpinning assumption for the process to transpire?arrow_forward
- Use the Feynman technique throughout. Assume that you’reexplaining the answer to someone who doesn’t know the topic at all. Write it all in paragraphs: 2. Give an overview of the equation of exchange (EoE) as used by Classical Theory. Now,carefully explain each variable in the EoE. What is meant by the “quantity theory of money”and how is it different from or the same as the equation of exchange?arrow_forwardZbsbwhjw8272:shbwhahwh Zbsbwhjw8272:shbwhahwh Zbsbwhjw8272:shbwhahwhZbsbwhjw8272:shbwhahwhZbsbwhjw8272:shbwhahwharrow_forwardUse the Feynman technique throughout. Assume that you’re explaining the answer to someone who doesn’t know the topic at all:arrow_forward
 Economics (MindTap Course List)EconomicsISBN:9781337617383Author:Roger A. ArnoldPublisher:Cengage Learning


 Exploring EconomicsEconomicsISBN:9781544336329Author:Robert L. SextonPublisher:SAGE Publications, Inc