
Concept explainers
Videos
Here’s Looking at You. According to University of Texas economist Daniel Hamermesh (Beauty Pays: Why Attractive People Are More Successful), strikingly attractive and good-looking men and women can expect to earn an average of $230,000 more in a lifetime than a person who is homely or plain. (Your author feels the need to start affirmative action for the beauty-bereft, consoled by the reality that looks are only one of many things that matter.) The bar graph shows the distribution of looks for American men and women, ranging from homely to strikingly attractive.
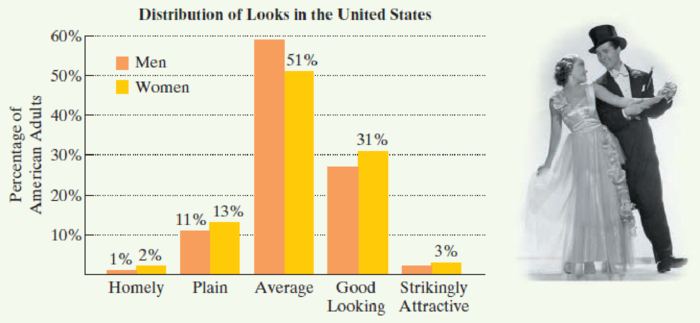
Source: Time, August 22, 2011
The percentage of average-looking men exceeds the percentage of strikingly attractive men by 57. The percentage of good-looking men exceeds the percentage of strikingly attractive men by 25. A total of 88% of American men range between average looking, good-looking, and strikingly attractive. Find the percentage of men who fall within each of these three categories of looks.

Trending nowThis is a popular solution!

Chapter 1 Solutions
College Algebra Essentials, Books a la Carte Edition Plus Mymathlab with New Pearson Etext -- Access Card Package


- InThe Northern Lights are bright flashes of colored light between 50 and 200 miles above Earth. Suppose a flash occurs 150 miles above Earth. What is the measure of arc BD, the portion of Earth from which the flash is visible? (Earth’s radius is approximately 4000 miles.)arrow_forwarde). n! (n - 1)!arrow_forwardSuppose you flip a fair two-sided coin four times and record the result. a). List the sample space of this experiment. That is, list all possible outcomes that could occur when flipping a fair two-sided coin four total times. Assume the two sides of the coin are Heads (H) and Tails (T).arrow_forward
- e). n! (n - 1)!arrow_forwardEvaluate the following expression and show your work to support your calculations. a). 6! b). 4! 3!0! 7! c). 5!2! d). 5!2! e). n! (n - 1)!arrow_forwardAmy and Samiha have a hat that contains two playing cards, one ace and one king. They are playing a game where they randomly pick a card out of the hat four times, with replacement. Amy thinks that the probability of getting exactly two aces in four picks is equal to the probability of not getting exactly two aces in four picks. Samiha disagrees. She thinks that the probability of not getting exactly two aces is greater. The sample space of possible outcomes is listed below. A represents an ace, and K represents a king. Who is correct?arrow_forward
 Algebra and Trigonometry (6th Edition)AlgebraISBN:9780134463216Author:Robert F. BlitzerPublisher:PEARSON
 Contemporary Abstract AlgebraAlgebraISBN:9781305657960Author:Joseph GallianPublisher:Cengage Learning
 Linear Algebra: A Modern IntroductionAlgebraISBN:9781285463247Author:David PoolePublisher:Cengage Learning
 Algebra And Trigonometry (11th Edition)AlgebraISBN:9780135163078Author:Michael SullivanPublisher:PEARSON
 Introduction to Linear Algebra, Fifth EditionAlgebraISBN:9780980232776Author:Gilbert StrangPublisher:Wellesley-Cambridge Press
 College Algebra (Collegiate Math)AlgebraISBN:9780077836344Author:Julie Miller, Donna GerkenPublisher:McGraw-Hill Education