Excursions in Modern Mathematics, Books a la carte edition (9th Edition)
9th Edition
ISBN: 9780134469041
Author: Peter Tannenbaum
Publisher: PEARSON
expand_more
expand_more
format_list_bulleted
Concept explainers
Videos
Textbook Question
Chapter 1, Problem 2E
Figure 1-9 shows the preference ballots for an election with 17 voters and 4 candidates. Write out the preference schedule for this election.
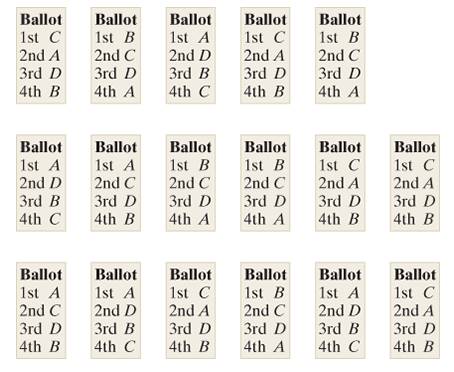
Figure 1-9
Expert Solution & Answer
Want to see the full answer?
Check out a sample textbook solution
Students have asked these similar questions
The following ordered data list shows the data speeds for cell phones used by a
telephone company at an airport:
A. Calculate the Measures of Central Tendency from the ungrouped data list.
B. Group the data in an appropriate frequency table.
C. Calculate the Measures of Central Tendency using the table in point B.
0.8
1.4
1.8
1.9
3.2
3.6
4.5
4.5
4.6
6.2
6.5
7.7
7.9
9.9
10.2
10.3
10.9
11.1
11.1
11.6
11.8
12.0
13.1
13.5
13.7
14.1
14.2
14.7
15.0
15.1
15.5
15.8
16.0
17.5
18.2
20.2
21.1
21.5
22.2
22.4
23.1
24.5
25.7
28.5
34.6
38.5
43.0
55.6
71.3
77.8
Solve for y
Solve for x
Chapter 1 Solutions
Excursions in Modern Mathematics, Books a la carte edition (9th Edition)
Ch. 1 - Figure 1-8 shows the preference ballots for an...Ch. 1 - Figure 1-9 shows the preference ballots for an...Ch. 1 - An election is held to choose the Chair of the...Ch. 1 - The student body at Eureka High School is having...Ch. 1 - An election is held using the printed-names format...Ch. 1 - Prob. 6ECh. 1 - Prob. 7ECh. 1 - Table 1-30 shows a conventional preference...Ch. 1 - The Demublican Party is holding its annual...Ch. 1 - The Epicurean Society is holding its annual...
Ch. 1 - Table 1-31 shows the preference schedule for an...Ch. 1 - Table 1-32 shows the preference schedule for an...Ch. 1 - Table 1-33 shows the preference schedule for an...Ch. 1 - Table 1-34 shows the preference schedule for an...Ch. 1 - Table 1-35 shows the preference schedule for an...Ch. 1 - Table1-36 shows the preference schedule for an...Ch. 1 - Table 1-25 see Exercise 3 shows the preference...Ch. 1 - Table 1-26 see Exercise 4 shows the preference...Ch. 1 - Table 1-25 see Exercise 3 shows the preference...Ch. 1 - Table 1-26 see Exercise 4 shows the preference...Ch. 1 - Table 1-31see Exercise 11 shows the preference...Ch. 1 - Table 1-32 see Exercise 12 shows the preference...Ch. 1 - Table 1-33 see Exercise 13 shows the preference...Ch. 1 - Table 1-34 Number of voters 6 6 5 4 3 3 1st A B B...Ch. 1 - Table 1-35 Percent of voters 24 23 19 14 11 9 1st...Ch. 1 - Table 1-36 Percent of voters 25 21 15 12 10 9 8...Ch. 1 - The Heisman Award. Table 1-37 shows the results...Ch. 1 - The 2014 AL Cy Young Award. Table 1-38 shows the...Ch. 1 - An election was held using the conventional Borda...Ch. 1 - Imagine that in the voting for the American League...Ch. 1 - Table 1-31 see Exercise 11 shows the preference...Ch. 1 - Table 1-32 see Exercise 12 shows the preference...Ch. 1 - Table1-33 Number of voters 6 5 4 2 2 2 2 1st C A B...Ch. 1 - Table 1-34 See Exercise 14 shows the preference...Ch. 1 - Table1-39_ shows the preference schedule for an...Ch. 1 - Table1-40_ shows the preference schedule for an...Ch. 1 - Table 1-35 see Exercise 15 shows the preference...Ch. 1 - Table 1-36 see Exercise 16 shows the preference...Ch. 1 - Top-Two Instant-Runoff Voting. Exercises 39 and 40...Ch. 1 - Top-Two Instant-Runoff Voting. Exercises 39 and 40...Ch. 1 - Table 1-31 see Exercise 11 shows the preference...Ch. 1 - Table 1-32 See Exercise 12 shows the preference...Ch. 1 - Table 1-33 see Exercise 13 shows the preference...Ch. 1 - Table 1-34 see Exercise 14 shows the preference...Ch. 1 - Table 1-35 see Exercise 15 shows the preference...Ch. 1 - Table 1-36 see Exercise 16 shows the preference...Ch. 1 - Table 1-39 see Exercise 35 shows the preference...Ch. 1 - Table1-40 see Exercise36 shows the preference...Ch. 1 - An election with five candidates A, B. C, D, and E...Ch. 1 - An election with six candidates A, B, C, D, E, and...Ch. 1 - Use Table 1-41 to illustrate why the Borda count...Ch. 1 - Use Table 1-32 to illustrate why the...Ch. 1 - Use Table 1-42 to illustrate why the plurality...Ch. 1 - Use the Math Club election Example 1.10 to...Ch. 1 - Use Table 1-43 to illustrate why the...Ch. 1 - Explain why the method of pair wise comparisons...Ch. 1 - Prob. 57ECh. 1 - Explain why the plurality method satisfies the...Ch. 1 - Explain why the Borda count method satisfies the...Ch. 1 - Explain why the method of pairwise comparisons...Ch. 1 - Two-candidate elections. Explain why when there...Ch. 1 - Alternative version of the Borda count. The...Ch. 1 - Reverse Borda count. Another commonly used...Ch. 1 - The average ranking. The average ranking of a...Ch. 1 - The 2006 Associated Press college football poll....Ch. 1 - The Pareto criterion. The following fairness...Ch. 1 - The 2003-2004 NBA Rookie of the Year vote. Each...Ch. 1 - Top-two IRV is a variation of the...Ch. 1 - The Coombs method. This method is just like the...Ch. 1 - Bucklin voting. This method was used in the early...Ch. 1 - The 2016 NBA MVP vote. The National Basketball...Ch. 1 - The Condorcet loser criterion. If there is a...Ch. 1 - Consider the following fairness criterion: If a...Ch. 1 - Suppose that the following was proposed as a...Ch. 1 - Consider a modified Borda count where a...
Additional Math Textbook Solutions
Find more solutions based on key concepts
Find how many SDs above the mean price would be predicted to cost.
Intro Stats, Books a la Carte Edition (5th Edition)
Find all solutions of each equation in the interval .
Precalculus: A Unit Circle Approach (3rd Edition)
147. Draining a tank Water drains from the conical tank shown in the accompanying figure at the rate .
a. What...
University Calculus
(a) Make a stem-and-leaf plot for these 24 observations on the number of customers who used a down-town CitiBan...
APPLIED STAT.IN BUS.+ECONOMICS
Find E(X) for each of the distributions given in Exercise 2.1-3.
Probability And Statistical Inference (10th Edition)
Knowledge Booster


Learn more about
Need a deep-dive on the concept behind this application? Look no further. Learn more about this topic, subject and related others by exploring similar questions and additional content below.Similar questions
- II Consider the following data matrix X: X1 X2 0.5 0.4 0.2 0.5 0.5 0.5 10.3 10 10.1 10.4 10.1 10.5 What will the resulting clusters be when using the k-Means method with k = 2. In your own words, explain why this result is indeed expected, i.e. why this clustering minimises the ESS map.arrow_forwardX Acellus | Student admin192c.acellus.com go 0:0 Hannah wants to have concrete stairs for her backdoor. How much concrete will be needed to build the stairs? 20 cm 70 cm 30 cm 15 cm 10 cm 45 cm cm 70 cm GIF 自 لاarrow_forwardwhy the answer is 3 and 10?arrow_forward
- 1 Hannah wants to have concrete stairs for her backdoor. How much concrete will be needed to build the stairs? 70 cm 30 cm 15 cm 10 cm 10 cm 20 cm 45 cm cm³ GIF GIF/ 2 3 4 qwe asdf 5 6 自 yu ty u 8 ghjk 9 P Z X C cv b vbnm ×arrow_forwardPS 9 Two films are shown on screen A and screen B at a cinema each evening. The numbers of people viewing the films on 12 consecutive evenings are shown in the back-to-back stem-and-leaf diagram. Screen A (12) Screen B (12) 8 037 34 7 6 4 0 534 74 1645678 92 71689 Key: 116|4 represents 61 viewers for A and 64 viewers for B A second stem-and-leaf diagram (with rows of the same width as the previous diagram) is drawn showing the total number of people viewing films at the cinema on each of these 12 evenings. Find the least and greatest possible number of rows that this second diagram could have. TIP On the evening when 30 people viewed films on screen A, there could have been as few as 37 or as many as 79 people viewing films on screen B.arrow_forwardskip A swimming pool plan has concrete stairs leading down into the shallow end How much concrete will be needed to build the stairs? Bift 9 ft 2 ft 1 ft 9 ft 2 ft 5 ft [ ? ] ft³arrow_forward
arrow_back_ios
SEE MORE QUESTIONS
arrow_forward_ios
Recommended textbooks for you
 Discrete Mathematics and Its Applications ( 8th I...MathISBN:9781259676512Author:Kenneth H RosenPublisher:McGraw-Hill Education
 Mathematics for Elementary Teachers with Activiti...MathISBN:9780134392790Author:Beckmann, SybillaPublisher:PEARSON
 Thinking Mathematically (7th Edition)MathISBN:9780134683713Author:Robert F. BlitzerPublisher:PEARSON
 Discrete Mathematics With ApplicationsMathISBN:9781337694193Author:EPP, Susanna S.Publisher:Cengage Learning,
 Pathways To Math Literacy (looseleaf)MathISBN:9781259985607Author:David Sobecki Professor, Brian A. MercerPublisher:McGraw-Hill Education
Discrete Mathematics and Its Applications ( 8th I...
Math
ISBN:9781259676512
Author:Kenneth H Rosen
Publisher:McGraw-Hill Education
Mathematics for Elementary Teachers with Activiti...
Math
ISBN:9780134392790
Author:Beckmann, Sybilla
Publisher:PEARSON
Thinking Mathematically (7th Edition)
Math
ISBN:9780134683713
Author:Robert F. Blitzer
Publisher:PEARSON
Discrete Mathematics With Applications
Math
ISBN:9781337694193
Author:EPP, Susanna S.
Publisher:Cengage Learning,
Pathways To Math Literacy (looseleaf)
Math
ISBN:9781259985607
Author:David Sobecki Professor, Brian A. Mercer
Publisher:McGraw-Hill Education
Mod-01 Lec-01 Discrete probability distributions (Part 1); Author: nptelhrd;https://www.youtube.com/watch?v=6x1pL9Yov1k;License: Standard YouTube License, CC-BY
Discrete Probability Distributions; Author: Learn Something;https://www.youtube.com/watch?v=m9U4UelWLFs;License: Standard YouTube License, CC-BY
Probability Distribution Functions (PMF, PDF, CDF); Author: zedstatistics;https://www.youtube.com/watch?v=YXLVjCKVP7U;License: Standard YouTube License, CC-BY
Discrete Distributions: Binomial, Poisson and Hypergeometric | Statistics for Data Science; Author: Dr. Bharatendra Rai;https://www.youtube.com/watch?v=lHhyy4JMigg;License: Standard Youtube License