
a.
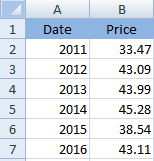
To show: The data in tabular form in new worksheet.
Introduction: An investor may purchase stock of a company and become the stockholder (owner) of the company. Based on the performance of the company and demand for company’s stocks, the value of company’s stocks increases or decreases.
a.
Explanation of Solution
The date have been shown in ‘column A’ while price of stock has been represented in ‘column’ B. The tabular presentation of the given data has been shown below:
b.
To compute:
Introduction: An investor may purchase stock of a company and become the stockholder (owner) of the company. Based on the performance of the company and demand for company’s stocks, the value of company’s stocks increases or decreases.
b.
Explanation of Solution
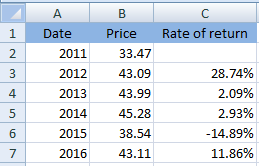
Rate of return for each year has been computed using the following formula:
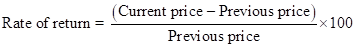
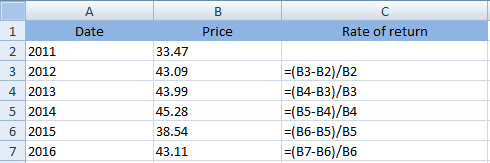
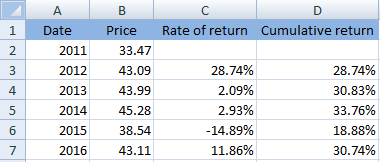
Thus, the calculated rate of return has been shown below:
c.
To compute: Cumulative total return since 2011.
Introduction: An investor may purchase stock of a company and become the stockholder (owner) of the company. Based on the performance of the company and demand for company’s stocks, the value of company’s stocks increases or decreases.
c.
Explanation of Solution
Cumulative rate of return can be computed by adding each year’s rate of return. It can be computed on excel using following formula:
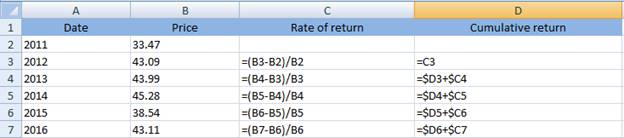
Thus, the calculated cumulative rate of return has been shown below:
d.
To compute: Rate of return for holding period and compound average rate of return.
Introduction: An investor may purchase stock of a company and become the stockholder (owner) of the company. Based on the performance of the company and demand for company’s stocks, the value of company’s stocks increases or decreases.
d.
Explanation of Solution
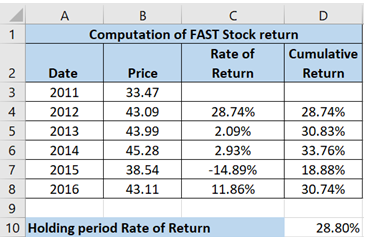
The rate of return for the holding period can be computed as:

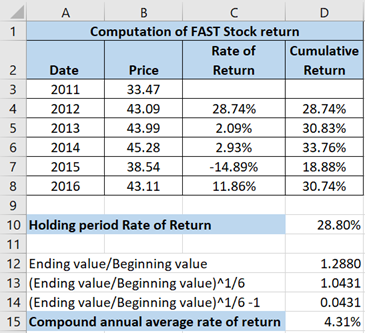
The calculated answer has been shown below:
Now, compound annual average of return can be computed using:

e.
To prepare: Line chart and scattered chart. Also, state the difference between the two charts and suggest the most suitable.
Introduction: An investor may purchase stock of a company and become the stockholder (owner) of the company. Based on the performance of the company and demand for company’s stocks, the value of company’s stocks increases or decreases.
e.
Explanation of Solution
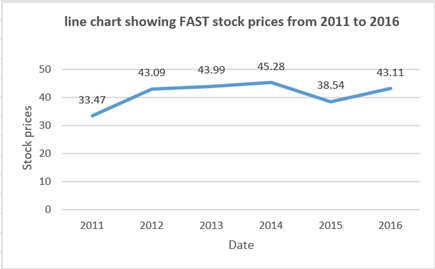
The line chart has been prepared for FAST stock prices:
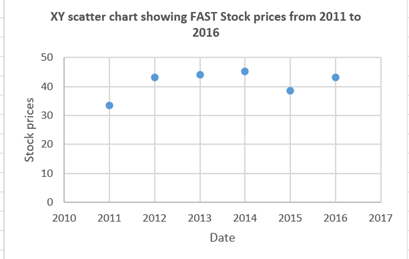
The scattered chart has been prepared for FAST stock prices:
Following are the differences between line and scatter chart:
Line chart: The values ??are plotted only on the y-axis i.e., the vertical axis. While, on the x-axis i.e., the horizontal axis the sequence number of the value is shown. Exceptions: graphs with the date on the X-axis.
Scatter chart: The relationship between two values is represented using the scatter chart. Scatter charts is often known as XY chart.
Here, two different values are not given which means there is no need to find the relationship between two values. So, in order to find trend of stock prices a line chart is more appropriate.
f.
To prepare: 3-D line chart and discuss if it helps in better understanding.
Introduction: An investor may purchase stock of a company and become the stockholder (owner) of the company. Based on the performance of the company and demand for company’s stocks, the value of company’s stocks increases or decreases.
f.
Explanation of Solution
The line chart has been prepared for FAST stock prices:

The 3-D line chart has been prepared:
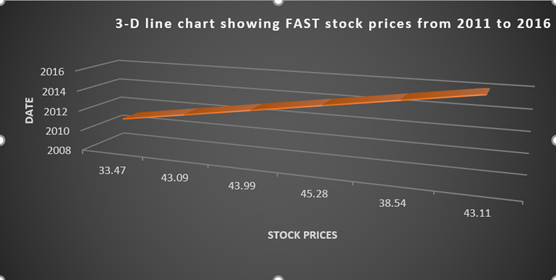
The comparison between the two charts can be seen easily. Thus, yes the enhancements will make data more attractive for the reader.
Want to see more full solutions like this?
Chapter 1 Solutions
EBK FINANCIAL ANALYSIS WITH MICROSOFT E

- Which of the following would be expected to hold its value best during a time of inflation? A certificate of deposit. A corporate bond. A house.arrow_forwardWhat is a budget? A spending plan showing sources and uses of income. A limit on spending that cannot be exceeded. The amount of money that a credit card will let youarrow_forwardThe Pan American Bottling Co. is considering the purchase of a new machine that would increase the speed of bottling and save money. The net cost of this machine is $60,000. The annual cash flows have the following projections: Year 1 ........... 2 ........... 3 ........... 4 ........... 5 ........... Cash Flow $23,000 26,000 29,000 15,000 8,000 a. If the cost of capital is 13 percent, what is the net present value of selecting a new machine? I need to see the work. I can't use Excel to solve the problem. Excel doesn't help me solve Part a.arrow_forward
- Pat and Chris have identical interest-bearing bank accounts that pay them $15 interest per year. Pat leaves the $15 in the account each year, while Chris takes the $15 home to a jar and never spends any of it. After five years, who has more money? Pat. Chris. They both have the same amount. Don’t knowarrow_forwardAssume a firm has earnings before depreciation and taxes of $200,000 and no depreciation. It is in a 25 percent tax bracket. a. Compute its cash flow using the following format: Earnings before depreciation and taxes _____Depreciation _____Earnings before taxes _____Taxes @ 25% _____Earnings after taxes _____Depreciation _____Cash Flow _____ b. Compute the cash flow for the company if depreciation is $200,000. Earnings before depreciation and taxes _____Depreciation _____Earnings before taxes _____Taxes @ 25% _____Earnings after taxes _____Depreciation _____Cash Flow _____ c. How large a cash flow benefit did the depreciation provide?arrow_forwardAssume a $40,000 investment and the following cash flows for two alternatives. Year Investment X Investment Y 1 $6,000 $15,000 2 8,000 20,000 3 9,000 10,000 4 17,000 — 5 20,000 — Which of the alternatives would you select under the payback method?arrow_forward
- The Short-Line Railroad is considering a $140,000 investment in either of two companies. The cashflows are as follows:Year Electric Co. Water Works1.................. $85,000 $30,0002.................. 25,000 25,0003.................. 30,000 85,0004–10............ 10,000 10,000a. Using the payback method, what will the decision be?b. Using the Net Present Value method, which is the better project? The discount rate is 10%.arrow_forwardWhat is corporate finance explain its important?arrow_forwardWhat is corporate finance? can you explain more?arrow_forward
- General accounting problem.arrow_forwardWhat do you know about corporate finance? tell me about thisarrow_forwardWhich of the following is the primary function of insurance? Making risk disappear. Pooling and sharing risk among the insured. Making someone else pay for an accident or loss. Don’t know.arrow_forward
