
Concept explainers
Videos
Carefully read through the list of terminology we’ve used in this Unit. Consider circling the terms you aren’t familiar with and looking them up. Then test your understanding by using the list to fill in the appropriate blank in each sentence. Hint: One word is used twice.
axis
bar graph
categorical frequency distribution
classes
commutative
complement
compound interest
coordinates
data
degrees
element
empirical probability
exponential growth
grouped frequency distribution
histogram
interest
intersection
like quantities
linear growth
lower limit
origin
perimeter
pie chart
plotting points
population
probability
raw data
rectangular
representative sample
roster method
sample
scale
scientific notation
set
simple interest
stem and leaf plot
theoretical probability
time-series data
time-series graph
union
universal set
upper limit
Venn diagram
well-defined
x axis
y axis
A _______________ is a diagram used to compare the relative sizes of different parts of a whole.
To fill: The blank space in the provided statement, “A______ is a diagram used to compare the relative sizes of different parts of a whole”. By the use of provided list.
Answer to Problem 1LSR
Solution:
A pie chart is a diagram used to compare the relative sizes of different parts of a whole.
Explanation of Solution
Given information:
The provided list is below:
Explanation:
Consider the provided statement.
As it is known that the pie chart is a circle which is divided into a number of slices where each slice gives information about a particular data.
For example, the given pie chart representation of marks obtained by a student in different subjects- English, Hindi, Mathematics, Science and Social Science in an examination.
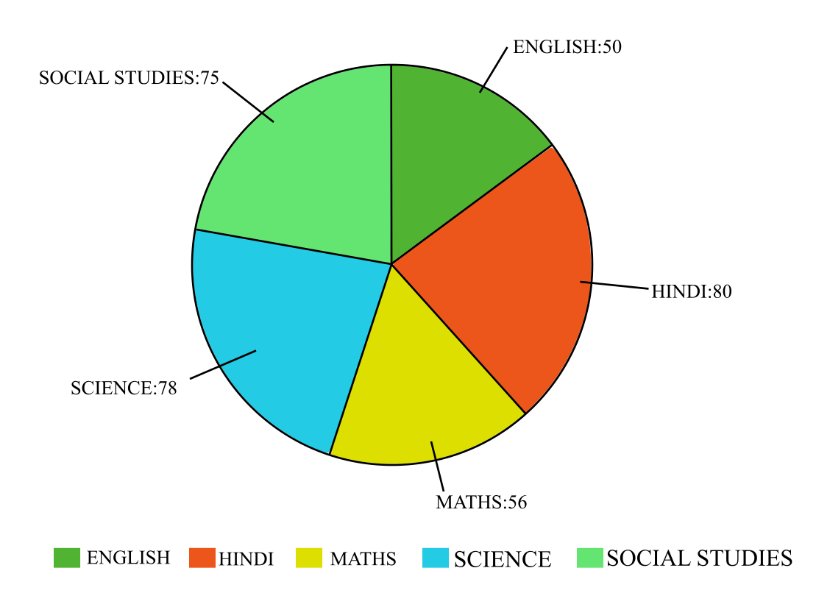
Therefore, the blank in the provided statement can be filled with the word pie chart.
Want to see more full solutions like this?
Chapter 1 Solutions
ALEKS 360 ACCESS CODE- PATHWAY MATH LIT
Additional Math Textbook Solutions
College Algebra (Collegiate Math)
Intermediate Algebra (13th Edition)
Finite Mathematics for Business, Economics, Life Sciences and Social Sciences
Intro Stats, Books a la Carte Edition (5th Edition)
Precalculus: Mathematics for Calculus (Standalone Book)


- Evaluate the triple integral 3' 23 HIG 2 +3 f(x, y, z)dxdydz where f(x, y, z) = x + 2x-y ม u = v = and w = 2 2 3 Triple Integral Region R -2 x N 2 y 3arrow_forwardFind the volume of the solid bounded below by the circular cone z = 2.5√√√x² + y² and above by the sphere x² + y²+z² = 6.5z.arrow_forwardElectric charge is distributed over the triangular region D shown below so that the charge density at (x, y) is σ(x, y) = 4xy, measured in coulumbs per square meter (C/m²). Find the total charge on D. Round your answer to four decimal places. 1 U 5 4 3 2 1 1 2 5 7 coulumbsarrow_forward
- Let E be the region bounded cone z = √√/6 - (x² + y²) and the sphere z = x² + y² + z² . Provide an answer accurate to at least 4 significant digits. Find the volume of E. Triple Integral Spherical Coordinates Cutout of sphere is for visual purposes 0.8- 0.6 z 04 0.2- 0- -0.4 -0.2 04 0 0.2 0.2 x -0.2 04 -0.4 Note: The graph is an example. The scale and equation parameters may not be the same for your particular problem. Round your answer to 4 decimal places. Hint: Solve the cone equation for phi. * Oops - try again.arrow_forwardThe temperature at a point (x,y,z) of a solid E bounded by the coordinate planes and the plane 9.x+y+z = 1 is T(x, y, z) = (xy + 8z +20) degrees Celcius. Find the average temperature over the solid. (Answer to 4 decimal places). Average Value of a function using 3 variables z 1- y Hint: y = -a·x+1 * Oops - try again. xarrow_forwardFind the saddle pointsarrow_forward
- Problem #5 Section A of my math class has 110 students. Section B of my math class has 80 students. a). If I randomly select 15 students from the combined classes, in a way that the order of my selection does not matter, what is the probability that all 15 students can from Section A? b). If I randomly select 15 students from the combined classes, in a way that the order of my selection does not matter, what is the probability that all 15 students can from Section B? c). If I randomly select 15 students from the combined classes, in a way that the order of my selection does not matter, what is the probability that all 7 students come from section A and 8 students come from section B?arrow_forwardProblem #6 A special passcode to unlock your phone consists of 4 digits where repeated digits are not allowed. If someone were to randomly guess a 4 digit passcode, what is the probability that they guess your passcode on the first try?arrow_forwardProblem #3 If a card is picked at random from a standard 52-card deck, what is the probability of getting a black card or a queen?arrow_forward
- Problem #1 In the 2010 census, it was reported that the United States had a population of 310 million people. Of those, 74 million were under the age of 18. If you chose a person from the U.S. population at random, what is the probability they are under the age of 18? Problem #2 Given a set S={1, 2, 3, 4, 5, 6, 7, 8, 9, 10}, if you were choosing a number at random what is the probability that you would choose an even number or a number larger than 7?arrow_forwardAnswer number twoarrow_forwardAnswer number onearrow_forward
 Holt Mcdougal Larson Pre-algebra: Student Edition...AlgebraISBN:9780547587776Author:HOLT MCDOUGALPublisher:HOLT MCDOUGAL
 Functions and Change: A Modeling Approach to Coll...AlgebraISBN:9781337111348Author:Bruce Crauder, Benny Evans, Alan NoellPublisher:Cengage Learning
 Glencoe Algebra 1, Student Edition, 9780079039897...AlgebraISBN:9780079039897Author:CarterPublisher:McGraw Hill
 Elementary AlgebraAlgebraISBN:9780998625713Author:Lynn Marecek, MaryAnne Anthony-SmithPublisher:OpenStax - Rice University
 Intermediate AlgebraAlgebraISBN:9781285195728Author:Jerome E. Kaufmann, Karen L. SchwittersPublisher:Cengage Learning