
Videos
CASE STUDY Chrysalises for Cash
The butterfly symbolizes the notion of personal change. Increasingly, people are turning to butterflies to consecrate meaningful
Due to the possibility of introducing an invasive species, butterfly suppliers are monitored by governmental agencies. Along with following regulations, butterfly suppliers must ensure quality and quantity of their product while maintaining a profit. To this end, an individual supplier may hire independent contractors to hatch the varieties needed. These entrepreneurs are paid a small fee for each chrysalis delivered, with a 50% bonus added for each hatched healthy butterfly. This fee structure provides little room for profit. Therefore, it is important that these contractors deliver a high proportion of healthy butterflies that emerge at a fairly predictable rate.
In Florida, one such entrepreneur specializes in harvesting the black swallowtail butterfly. In nature, the female butterfly seeks plants, such as carrot and parsley, to harvest and lay eggs on. A newly hatched caterpillar consumes the host plant, then secures itself and sheds its skin, revealing a chrysalis. During this resting phase, environmental factors such as temperature and humidity may affect the transformation process. Typically, the black swallowtail takes about 1 week to complete its metamorphosis and emerge from its chrysalis. The transformation occasionally results in deformities
The Florida contractor believes that there are differences in quality and emergence time among his broods. Not having taken a scientific approach to the problem, he relies on his memory of seasons past. It seems to him that late-season butterflies emerge sooner and with a greater number of deformities than their early-season counterparts. He also speculates that the type and nutritional value of the food consumed by the caterpillar might contribute to any observed differences. This year he is committed to a more formal approach to his butterfly harvest.
Since it takes 2 days to deliver the chrysalises from the contractor to the supplier, it is important that the butterflies do not emerge prematurely. It is equally important that the number of defective butterflies be minimized. With these two goals in mind, the contractor seeks the best combination of food source, fertilizer, and brood season to maximize his profits. To examine the effects of these variables on emergence time and number of deformed butterflies, the entrepreneur designed the following experiment.
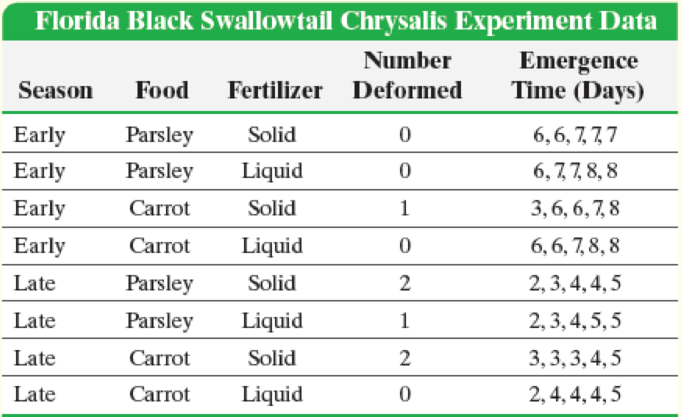
Eight identical pots were filled with equal amounts of a soil and watered carefully to ensure consistency. Two pots of carrot plants and two of parsley were set outside during the early part of the brood season. For the carrot pair, one pot was fed a fixed amount of liquid fertilizer, while the other was fed a nutritionally similar amount of solid fertilizer. The two pots of parsley were similarly fertilized. All four pots were placed next to each other to ensure similar exposures to environmental conditions such as temperature and solar radiation. Five black swallowtail caterpillars of similar age were placed into each container, each allowed to mature and form a chrysalis. The time from chrysalis formation until emergence was reported to the nearest day, along with any defects. The same procedure was followed with the four pots that were placed outdoors during the late brood season.
Write a report describing the experimental goals and design for the entrepreneur’s experiment. Follow the procedure outlined in the box on steps in designing and conducting an experiment (p. 44). Step 5(b), of this procedure is provided in the following table and should be included in your report.
In your report, provide a general descriptive analysis of these data. Be sure to include recommendations for the combination of season, food source, and type of fertilizer that result in the fewest deformed butterflies while achieving a long emergence time. Conclude your report with recommendations for further experiments. For each proposed experiment, be sure to do the following:
1. State the problem to be solved and define the response variables.
Want to see the full answer?
Check out a sample textbook solution
Chapter 1 Solutions
Fundamentals of Statistics Plus MyLab Statistics with Pearson eText - Title-Specific Access Card Package (5th Edition)


- step by step on Microssoft on how to put this in excel and the answers please Find binomial probability if: x = 8, n = 10, p = 0.7 x= 3, n=5, p = 0.3 x = 4, n=7, p = 0.6 Quality Control: A factory produces light bulbs with a 2% defect rate. If a random sample of 20 bulbs is tested, what is the probability that exactly 2 bulbs are defective? (hint: p=2% or 0.02; x =2, n=20; use the same logic for the following problems) Marketing Campaign: A marketing company sends out 1,000 promotional emails. The probability of any email being opened is 0.15. What is the probability that exactly 150 emails will be opened? (hint: total emails or n=1000, x =150) Customer Satisfaction: A survey shows that 70% of customers are satisfied with a new product. Out of 10 randomly selected customers, what is the probability that at least 8 are satisfied? (hint: One of the keyword in this question is “at least 8”, it is not “exactly 8”, the correct formula for this should be = 1- (binom.dist(7, 10, 0.7,…arrow_forwardKate, Luke, Mary and Nancy are sharing a cake. The cake had previously been divided into four slices (s1, s2, s3 and s4). What is an example of fair division of the cake S1 S2 S3 S4 Kate $4.00 $6.00 $6.00 $4.00 Luke $5.30 $5.00 $5.25 $5.45 Mary $4.25 $4.50 $3.50 $3.75 Nancy $6.00 $4.00 $4.00 $6.00arrow_forwardFaye cuts the sandwich in two fair shares to her. What is the first half s1arrow_forward
- Question 2. An American option on a stock has payoff given by F = f(St) when it is exercised at time t. We know that the function f is convex. A person claims that because of convexity, it is optimal to exercise at expiration T. Do you agree with them?arrow_forwardQuestion 4. We consider a CRR model with So == 5 and up and down factors u = 1.03 and d = 0.96. We consider the interest rate r = 4% (over one period). Is this a suitable CRR model? (Explain your answer.)arrow_forwardQuestion 3. We want to price a put option with strike price K and expiration T. Two financial advisors estimate the parameters with two different statistical methods: they obtain the same return rate μ, the same volatility σ, but the first advisor has interest r₁ and the second advisor has interest rate r2 (r1>r2). They both use a CRR model with the same number of periods to price the option. Which advisor will get the larger price? (Explain your answer.)arrow_forward
- Question 5. We consider a put option with strike price K and expiration T. This option is priced using a 1-period CRR model. We consider r > 0, and σ > 0 very large. What is the approximate price of the option? In other words, what is the limit of the price of the option as σ∞. (Briefly justify your answer.)arrow_forwardQuestion 6. You collect daily data for the stock of a company Z over the past 4 months (i.e. 80 days) and calculate the log-returns (yk)/(-1. You want to build a CRR model for the evolution of the stock. The expected value and standard deviation of the log-returns are y = 0.06 and Sy 0.1. The money market interest rate is r = 0.04. Determine the risk-neutral probability of the model.arrow_forwardSeveral markets (Japan, Switzerland) introduced negative interest rates on their money market. In this problem, we will consider an annual interest rate r < 0. We consider a stock modeled by an N-period CRR model where each period is 1 year (At = 1) and the up and down factors are u and d. (a) We consider an American put option with strike price K and expiration T. Prove that if <0, the optimal strategy is to wait until expiration T to exercise.arrow_forward
- We consider an N-period CRR model where each period is 1 year (At = 1), the up factor is u = 0.1, the down factor is d = e−0.3 and r = 0. We remind you that in the CRR model, the stock price at time tn is modeled (under P) by Sta = So exp (μtn + σ√AtZn), where (Zn) is a simple symmetric random walk. (a) Find the parameters μ and σ for the CRR model described above. (b) Find P Ste So 55/50 € > 1). StN (c) Find lim P 804-N (d) Determine q. (You can use e- 1 x.) Ste (e) Find Q So (f) Find lim Q 004-N StN Soarrow_forwardIn this problem, we consider a 3-period stock market model with evolution given in Fig. 1 below. Each period corresponds to one year. The interest rate is r = 0%. 16 22 28 12 16 12 8 4 2 time Figure 1: Stock evolution for Problem 1. (a) A colleague notices that in the model above, a movement up-down leads to the same value as a movement down-up. He concludes that the model is a CRR model. Is your colleague correct? (Explain your answer.) (b) We consider a European put with strike price K = 10 and expiration T = 3 years. Find the price of this option at time 0. Provide the replicating portfolio for the first period. (c) In addition to the call above, we also consider a European call with strike price K = 10 and expiration T = 3 years. Which one has the highest price? (It is not necessary to provide the price of the call.) (d) We now assume a yearly interest rate r = 25%. We consider a Bermudan put option with strike price K = 10. It works like a standard put, but you can exercise it…arrow_forwardIn this problem, we consider a 2-period stock market model with evolution given in Fig. 1 below. Each period corresponds to one year (At = 1). The yearly interest rate is r = 1/3 = 33%. This model is a CRR model. 25 15 9 10 6 4 time Figure 1: Stock evolution for Problem 1. (a) Find the values of up and down factors u and d, and the risk-neutral probability q. (b) We consider a European put with strike price K the price of this option at time 0. == 16 and expiration T = 2 years. Find (c) Provide the number of shares of stock that the replicating portfolio contains at each pos- sible position. (d) You find this option available on the market for $2. What do you do? (Short answer.) (e) We consider an American put with strike price K = 16 and expiration T = 2 years. Find the price of this option at time 0 and describe the optimal exercising strategy. (f) We consider an American call with strike price K ○ = 16 and expiration T = 2 years. Find the price of this option at time 0 and describe…arrow_forward

 Glencoe Algebra 1, Student Edition, 9780079039897...AlgebraISBN:9780079039897Author:CarterPublisher:McGraw Hill
 Algebra: Structure And Method, Book 1AlgebraISBN:9780395977224Author:Richard G. Brown, Mary P. Dolciani, Robert H. Sorgenfrey, William L. ColePublisher:McDougal Littell
 Algebra & Trigonometry with Analytic GeometryAlgebraISBN:9781133382119Author:SwokowskiPublisher:Cengage
 Holt Mcdougal Larson Pre-algebra: Student Edition...AlgebraISBN:9780547587776Author:HOLT MCDOUGALPublisher:HOLT MCDOUGAL
 Trigonometry (MindTap Course List)TrigonometryISBN:9781337278461Author:Ron LarsonPublisher:Cengage Learning