
Concept explainers
Videos
a.
Compute the differences of the sales between October 2015 and October 2014.
List the manufacturers for whom, the sales in 2015 increased as compared to 2014.
List the manufacturers for whom, the sales in 2015 decreased as compared to 2014.
a.
Answer to Problem 17CE
The differences of the sales between October 2015 and October 2014 are as follows:
| Manufacturer | Through October 2015 | Through October 2014 | Difference |
| General Motors Corp. | 2,562,840 | 2,434,707 | 128,133 |
| Ford Motor Company | 2,178,587 | 2,065,612 | 112,975 |
| Toyota Motor Sales USA Inc. | 2,071,446 | 1,975,368 | 96,078 |
| Chrysler | 1,814,268 | 1,687,313 | 12,6955 |
| American Honda Motor Co Inc. | 1,320,217 | 1,281,777 | 38,440 |
| Nissan North America Inc. | 1,238,535 | 1,166,389 | 72,146 |
| Hyundai Motor America | 638,195 | 607,539 | 30,656 |
| Kia Motors America Inc. | 526,024 | 489,711 | 36,313 |
| Subaru of America Inc. | 480,331 | 418,497 | 61,834 |
| Volkswagen of America Inc. | 294,602 | 301,187 | –6,585 |
| Mercedes-Benz | 301,915 | 281,728 | 20,187 |
| BMW of North America Inc. | 279,395 | 267,193 | 12,202 |
| Mazda Motor of America Inc. | 267,158 | 259,751 | 7,407 |
| Audi of America Inc. | 165,103 | 146,133 | 18,970 |
| Mitsubishi Motors N A, Inc. | 80,683 | 64,564 | 16,119 |
| Volvo | 53,803 | 47,823 | 5,980 |
| Land Rover ** | 55,602 | 42,067 | 13,535 |
| Fiat | 35,576 | 39,226 | –3,650 |
| Porsche Cars NA Inc. | 43,370 | 39,033 | 4,337 |
| Jaguar * | 12,204 | 12,837 | –633 |
| Tesla * | 17,350 | 15,500 | 1,850 |
| Mini * | 49,061 | 44,488 | 4,573 |
| Maserati * | 9,544 | 10,327 | –783 |
| Smart * | 6,153 | 8,665 | –2,512 |
| Bentley * | 1,917 | 2,268 | –351 |
| Ferrari * | 1,903 | 1,739 | 164 |
| Rolls Royce * | 701 | 682 | 19 |
| Lamborghini * | 866 | 494 | 372 |
The manufacturers for whom, the sales in 2015 increased as compared to 2014 are as follows:
| Manufacturer | Through October 2015 | Through October 2014 | Difference |
| General Motors Corp. | 2,562,840 | 2,434,707 | 128,133 |
| Ford Motor Company | 2,178,587 | 2,065,612 | 112,975 |
| Toyota Motor Sales USA Inc. | 2,071,446 | 1,975,368 | 96,078 |
| Chrysler | 1,814,268 | 1,687,313 | 12,6955 |
| American Honda Motor Co Inc. | 1,320,217 | 1,281,777 | 38,440 |
| Nissan North America Inc. | 1,238,535 | 1,166,389 | 72,146 |
| Hyundai Motor America | 638,195 | 607,539 | 30,656 |
| Kia Motors America Inc. | 526,024 | 489,711 | 36,313 |
| Subaru of America Inc. | 480,331 | 418,497 | 61,834 |
| Mercedes-Benz | 301,915 | 281,728 | 20,187 |
| BMW of North America Inc. | 279,395 | 267,193 | 12,202 |
| Mazda Motor of America Inc. | 267,158 | 259,751 | 7,407 |
| Audi of America Inc. | 165,103 | 146,133 | 18,970 |
| Mitsubishi Motors N A, Inc. | 80,683 | 64,564 | 16,119 |
| Volvo | 53,803 | 47,823 | 5,980 |
| Land Rover ** | 55,602 | 42,067 | 13,535 |
| Porsche Cars NA Inc. | 43,370 | 39,033 | 4,337 |
| Tesla * | 17,350 | 15,500 | 1,850 |
| Mini * | 49,061 | 44,488 | 4,573 |
| Ferrari * | 1,903 | 1,739 | 164 |
| Rolls Royce * | 701 | 682 | 19 |
| Lamborghini * | 866 | 494 | 372 |
The manufacturers for whom, the sales in 2015 decreased as compared to 2014 are as follows:
| Manufacturer | Through October 2015 | Through October 2014 | Difference |
| Volkswagen of America Inc. | 294,602 | 301,187 | –6,585 |
| Fiat | 35,576 | 39,226 | –3,650 |
| Jaguar * | 12,204 | 12,837 | –633 |
| Maserati * | 9,544 | 10,327 | –783 |
| Smart * | 6,153 | 8,665 | –2,512 |
| Bentley * | 1,917 | 2,268 | –351 |
Explanation of Solution
Calculation:
The manufacturers for whom, data is missing for one or both the years are ignored.
Step-by-step procedure to calculate the differences of the sales between October 2015 and October 2014 using EXCEL is given below:
- Type the headings Manufacturer, Through October 2015, and Through October 2014, in cells A1, B1 and C1 respectively.
- Enter the manufacturers’ names in cells A2 to A29; the data for 2015 in cells B2 to B29; enter the data for 2014 in cells C2 to C29.
- Type the heading Difference in cell D1.
- Type the formula =B2-C2 in cell D2, and press Enter.
- Drag the cell till cell D29.
Thus, the differences are obtained using EXCEL.
The manufacturers with positive differences are the ones, for whom, the sales in 2015 increased as compared to 2014.
The manufacturers with negative differences are the ones, for whom, the sales in 2015 decreased as compared to 2014.
These can be identified from the list of differences obtained using software.
b.
Compute the percentage changes in sales between October 2015 and October 2014 and list them in an ascending order.
List the top 5 manufacturers in terms of percentage change.
List the bottom 5 manufacturers in terms of percentage change.
b.
Answer to Problem 17CE
The percentage changes in sales between October 2015 and October 2014 in an ascending order are as follows:
| Manufacturer | Through October 2015 | Through October 2014 | Percentage change (%) |
| Smart * | 6,153 | 8,665 | –28.99 |
| Bentley * | 1,917 | 2,268 | –15.48 |
| Fiat | 35,576 | 39,226 | –9.31 |
| Maserati * | 9,544 | 10,327 | –7.58 |
| Jaguar * | 12,204 | 12,837 | –4.93 |
| Volkswagen of America Inc. | 2,94,602 | 3,01,187 | –2.19 |
| Rolls Royce * | 701 | 682 | 2.79 |
| Mazda Motor of America Inc. | 2,67,158 | 2,59,751 | 2.85 |
| American Honda Motor Co Inc. | 1,320,217 | 1,281,777 | 3.00 |
| BMW of North America Inc. | 279,395 | 267,193 | 4.57 |
| Toyota Motor Sales USA Inc. | 2,071,446 | 1.975,368 | 4.86 |
| Hyundai Motor America | 638,195 | 607,539 | 5.05 |
| General Motors Corp. | 2,562,840 | 2,434,707 | 5.26 |
| Ford Motor Company | 2,178,587 | 2,065,612 | 5.47 |
| Nissan North America Inc. | 1,238,535 | 1,166,389 | 6.19 |
| Mercedes-Benz | 301,915 | 281,728 | 7.17 |
| Kia Motors America Inc. | 526,024 | 489,711 | 7.42 |
| Chrysler | 1,814,268 | 1,687,313 | 7.52 |
| Ferrari * | 1,903 | 1,739 | 9.43 |
| Mini * | 49,061 | 44,488 | 10.28 |
| Porsche Cars NA Inc. | 43,370 | 39,033 | 11.11 |
| Tesla * | 17,350 | 15,500 | 11.94 |
| Volvo | 53,803 | 47,823 | 12.50 |
| Audi of America Inc. | 165,103 | 146,133 | 12.98 |
| Subaru of America Inc. | 480,331 | 418,497 | 14.78 |
| Mitsubishi Motors N A, Inc. | 80,683 | 64,564 | 24.97 |
| Land Rover ** | 55,602 | 42,067 | 32.17 |
| Lamborghini * | 866 | 494 | 75.30 |
The top 5 manufacturers in terms of percentage change are as follows:
| Manufacturer | Through October 2015 | Through October 2014 | Percentage change (%) |
| Lamborghini * | 866 | 494 | 75.30 |
| Land Rover ** | 55,602 | 42,067 | 32.17 |
| Mitsubishi Motors N A, Inc. | 80,683 | 64,564 | 24.97 |
| Subaru of America Inc. | 480,331 | 418,497 | 14.78 |
| Audi of America Inc. | 165,103 | 146,133 | 12.98 |
The bottom 5 manufacturers in terms of percentage change are as follows:
| Manufacturer | Through October 2015 | Through October 2014 | Percentage change (%) |
| Smart * | 6,153 | 8,665 | –28.99 |
| Bentley * | 1,917 | 2,268 | –15.48 |
| Fiat | 35,576 | 39,226 | –9.31 |
| Maserati * | 9,544 | 10,327 | –7.58 |
| Jaguar * | 12,204 | 12,837 | –4.93 |
Explanation of Solution
Calculation:
Step-by-step procedure to calculate the percentage changes of the sales between October 2015 and October 2014 and to sort the changes using EXCEL is given below:
- Type the heading Percentage change in cell E1.
- Type the formula =(D2/C2)*100 in cell E2, and press Enter.
- Drag the cell till cell E29.
- Select the values in cells E2 to E29 and choose Editing > Sort & Filter > Sort Smallest to Largest > Expand Selection > OK.
Thus, the sorted percentage changes are obtained using EXCEL.
The manufacturers with the top 5 and bottom 5 percentage changes can be identified from the list of percentage changes obtained using software.
c.
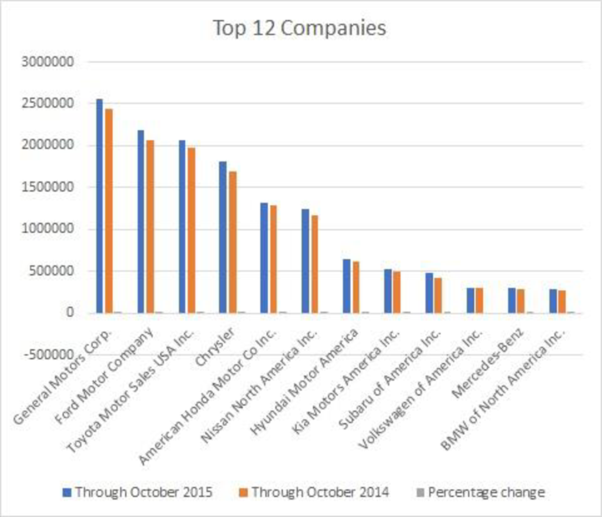
Draw a bar graph of the data in 2014 and 2015, sorted with respect to 2015 for the top 12 manufacturers.
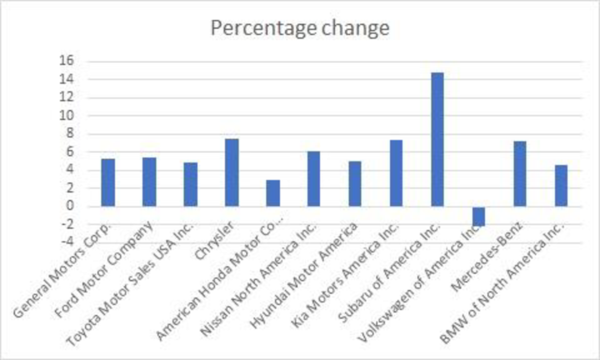
Draw a bar graph of the percentage changes, sorted with respect to 2015 for the top 12 manufacturers.
c.
Answer to Problem 17CE
The bar graph of the data in 2014 and 2015, sorted with respect to 2015 for the top 12 manufacturers is as follows:
The bar graph of the percentage changes, sorted with respect to 2015 for the top 12 manufacturers is as follows:
Explanation of Solution
Calculation:
The data are already sorted with respect to 2015. The observations in rows 2 to 13, under columns A to E, correspond to the top 12 companies.
Step-by-step procedure to bar graph of the data in 2014 and 2015, sorted with respect to 2015 for the top 12 manufacturers using EXCEL is given below:
- Select cells A1 to C13.
- Choose Insert > Insert Column or Bar Chart > 2-D Column > Clustered Column.
Thus, the bar graph of the data in 2014 and 2015, sorted with respect to 2015 for the top 12 manufacturers is obtained using EXCEL.
Step-by-step procedure to bar graph of the percentage changes, sorted with respect to 2015 for the top 12 manufacturers using EXCEL is given below:
- Select cells A1 to A13, and E1 to E13.
- Choose Insert > Insert Column or Bar Chart > 2-D Column > Clustered Column.
Thus, the bar graph of the percentage changes, sorted with respect to 2015 for the top 12 manufacturers is obtained using EXCEL.
From the first bar graph, it can be observed that for most of the top 12 companies, the bars are higher for 2015 than for 2014, which indicates that the sales have increased from 2014 to 2015. However, for the 10th company in the list, the sales have slightly decreased in 2015, as compared to 2014, as suggested by the heights of the bars.
From the second bar graph, it can be observed that the sales have increased by 4% to 6%, from 2014 to 2015, for most of the top 12 companies. However, aa few notable differences are also observed. The sales for the 5th company on the list have increased only by about 3%. The sales for the 10th company on the list has, in fact, reduced by about 2%. The ales of the 9th company on the list has increased by approximately 15%, which is quite high as compared to the others.
Want to see more full solutions like this?
Chapter 1 Solutions
Gen Combo Ll Statistical Techniques In Business And Economics; Connect Ac


- A company found that the daily sales revenue of its flagship product follows a normal distribution with a mean of $4500 and a standard deviation of $450. The company defines a "high-sales day" that is, any day with sales exceeding $4800. please provide a step by step on how to get the answers in excel Q: What percentage of days can the company expect to have "high-sales days" or sales greater than $4800? Q: What is the sales revenue threshold for the bottom 10% of days? (please note that 10% refers to the probability/area under bell curve towards the lower tail of bell curve) Provide answers in the yellow cellsarrow_forwardFind the critical value for a left-tailed test using the F distribution with a 0.025, degrees of freedom in the numerator=12, and degrees of freedom in the denominator = 50. A portion of the table of critical values of the F-distribution is provided. Click the icon to view the partial table of critical values of the F-distribution. What is the critical value? (Round to two decimal places as needed.)arrow_forwardA retail store manager claims that the average daily sales of the store are $1,500. You aim to test whether the actual average daily sales differ significantly from this claimed value. You can provide your answer by inserting a text box and the answer must include: Null hypothesis, Alternative hypothesis, Show answer (output table/summary table), and Conclusion based on the P value. Showing the calculation is a must. If calculation is missing,so please provide a step by step on the answers Numerical answers in the yellow cellsarrow_forward
 Algebra: Structure And Method, Book 1AlgebraISBN:9780395977224Author:Richard G. Brown, Mary P. Dolciani, Robert H. Sorgenfrey, William L. ColePublisher:McDougal Littell
 Elementary AlgebraAlgebraISBN:9780998625713Author:Lynn Marecek, MaryAnne Anthony-SmithPublisher:OpenStax - Rice University
 Intermediate AlgebraAlgebraISBN:9781285195728Author:Jerome E. Kaufmann, Karen L. SchwittersPublisher:Cengage Learning
 Algebra for College StudentsAlgebraISBN:9781285195780Author:Jerome E. Kaufmann, Karen L. SchwittersPublisher:Cengage Learning
 Glencoe Algebra 1, Student Edition, 9780079039897...AlgebraISBN:9780079039897Author:CarterPublisher:McGraw Hill