
Concept explainers
Videos
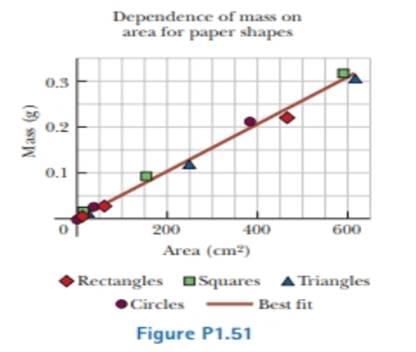
Review. A student is supplied with a stack of copy paper, ruler, compass, scissors, and a sensitive balance. He cuts out various shapes in various sizes, calculates their areas, measures their masses, and prepares the graph of Figure PI.51. (a) Consider the fourth experimental point from the top. How far is it from the best-lit straight line? Express your answer as a difference in vertical-axis coordinate, (b) Express your answer as a percentage, (c) Calculate the slope of the line, (d) State what the graph demonstrates, referring to the shape of the graph and the results of parts (b) and (c). (e) Describe whether this result should be expected theoretically, (f) Describe the physical meaning of the slope.
(a)
The distance of the fourth experimental point from the top from the best –fit straight line.
Answer to Problem 1.51P
The distance of the fourth experimental point from the top from the best fit straight line is
Explanation of Solution
Given data: The student is supplied with a stack of copy paper, ruler, compass, scissors, and a sensitive balance. A graph mass versus area is plotted for different sizes of the paper.
Consider the following figure.
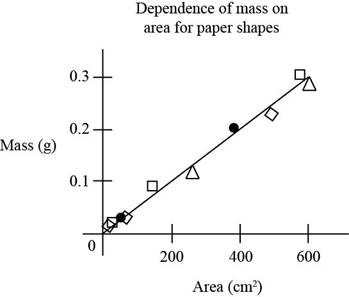
Figure (1)
Figure indicates the graph plotted area of pieces versus mass of the pieces of the paper.
The fourth experimental point from the top is a circle. It lies slightly above the best fit line.
From figure (1), the vertical coordinate for the forth experiment is
So the difference in the vertical axis coordinate is,
Here,
Substitute
Conclusion:
Therefore the distance of the fourth experimental point from the top from the best fit straight line is
(b)
The answer in the form of percentage.
Answer to Problem 1.51P
The answer in the form of percentage is
Explanation of Solution
Given data: The student is supplied with a stack of copy paper, ruler, compass, scissors, and a sensitive balance. A graph mass versus area is plotted for different sizes of the paper.
The expression for the percentage is,
Substitute
Conclusion:
Therefore the answer in the form of percentage is
(c)
The slope of the line.
Answer to Problem 1.51P
The slope of the line is
Explanation of Solution
Given data: The student is supplied with a stack of copy paper, ruler, compass, scissors, and a sensitive balance. A graph mass versus area is plotted for different sizes of the paper.
The expression for the slope is,
Here,
Substitute
Conclusion:
Therefore the slope of the line is
(d)
The demonstration from the graph referring to the shape of the graph and the results of part (b) and (c).
Answer to Problem 1.51P
The graph demonstrates that the mass of the cutout is proportional to its area for the shape cuts from this copy paper and the proportionality constant is
Explanation of Solution
Given data: The student is supplied with a stack of copy paper, ruler, compass, scissors, and a sensitive balance. A graph mass versus area is plotted for different sizes of the paper.
The graph given figure (1) demonstrates that the mass of the cutout in each shape is proportional to its area for the shape cuts from this copy paper and the proportionality constant is
The value of the slope from part (c) of the question and from the part (b) question the percentage uncertainty is
Conclusion:
Therefore the graph demonstrates that the mass of the cutout is proportional to its area for the shape cuts from this copy paper and the proportionality constant is
(e)
Whether this result should be expected theoretically or not.
Answer to Problem 1.51P
This result is to be expected theoretically if the paper has thickness and density that are uniform within the experimental uncertainty.
Explanation of Solution
Given data: The student is supplied with a stack of copy paper, ruler, compass, scissors, and a sensitive balance. A graph mass versus area is plotted for different sizes of the paper.
The graph given figure (1) demonstrates that the mass of the cutout in each shape is proportional to its area for the shape cuts from this copy paper and the proportionality constant is
The value of the slope from part (c) of the question is
Thus this result is expected theoretically when the object is having same aerial mass density and the paper has thickness and density that are uniform within the experimental uncertainty.
Conclusion:
Therefore this result is to be expected theoretically if the paper has thickness and density that are uniform within the experimental uncertainty.
(f)
The physical meaning of the slope.
Answer to Problem 1.51P
The physical meaning of the slope is the aerial density of the paper that represents the mass per unit area.
Explanation of Solution
Given data: The student is supplied with a stack of copy paper, ruler, compass, scissors, and a sensitive balance. A graph mass versus area is plotted for different sizes of the paper.
The graph given figure (1) demonstrates that the mass of the cutout in each shape is proportional to its area for the shape cuts from this copy paper and the proportionality constant is
The value of the slope from part (c) of the question is
The physical meaning of the slope is the aerial density of the paper that represent the mass per unit area.
Conclusion:
Therefore the physical meaning of the slope is the aerial density of the paper that represents the mass per unit area.
Want to see more full solutions like this?
Chapter 1 Solutions
Physics for Scientists and Engineers (AP Edition)
Additional Science Textbook Solutions
Biology: Concepts and Investigations
Applications and Investigations in Earth Science (9th Edition)
Biology: Life on Earth (11th Edition)
Organic Chemistry
Fundamentals Of Thermodynamics
Laboratory Manual For Human Anatomy & Physiology


- Q: What is the direction of the magnetic field at point A, due to the current I in a wire, in each of the cases 1 to 6 shown below? Note: point A is in the plane of the page. ▪A I I ▪A (1) (2) ▪A • I (out of page) (3) ▪A I x I (into page) ▪A ▪A I (4) (5) (6)arrow_forwardA tennis ball is thrown into the air with initial speed vo=46 m/s and angle (theta) 38 degrees from the ground. Find the distance it travels (x) when it hits the ground.arrow_forwardProblem 04.08 (17 points). Answer the following questions related to the figure below. ථි R₁ www R₂ E R₁ www ли R₁ A Use Kirchhoff's laws to calculate the currents through each battery and resistor in terms of R1, R2, E1, & E2. B Given that all the resistances and EMFs have positive values, if E₁ > E2 and R₁ > R2, which direction is the current flowing through E₁? Through R₂? C If E1 E2 and R₁ > R2, which direction is the current flowing through E₁? Through R2?arrow_forward
- A 105- and a 45.0-Q resistor are connected in parallel. When this combination is connected across a battery, the current delivered by the battery is 0.268 A. When the 45.0-resistor is disconnected, the current from the battery drops to 0.0840 A. Determine (a) the emf and (b) the internal resistance of the battery. 10 R2 R₁ ww R₁ Emf 14 Emf Final circuit Initial circuitarrow_forwardA ball is shot at an angle of 60° with the ground. What should be the initial velocity of the ball so that it will go inside the ring 8 meters away and 3 meters high. Suppose that you want the ball to be scored exactly at the buzzer, determine the required time to throw and shoot the ball. Full solution and figure if there is.arrow_forwardCorrect answer please. I will upvote.arrow_forward
- Define operational amplifierarrow_forwardA bungee jumper plans to bungee jump from a bridge 64.0 m above the ground. He plans to use a uniform elastic cord, tied to a harness around his body, to stop his fall at a point 6.00 m above the water. Model his body as a particle and the cord as having negligible mass and obeying Hooke's law. In a preliminary test he finds that when hanging at rest from a 5.00 m length of the cord, his body weight stretches it by 1.55 m. He will drop from rest at the point where the top end of a longer section of the cord is attached to the bridge. (a) What length of cord should he use? Use subscripts 1 and 2 respectively to represent the 5.00 m test length and the actual jump length. Use Hooke's law F = KAL and the fact that the change in length AL for a given force is proportional the length L (AL = CL), to determine the force constant for the test case and for the jump case. Use conservation of mechanical energy to determine the length of the rope. m (b) What maximum acceleration will he…arrow_forward9 V 300 Ω www 100 Ω 200 Ω www 400 Ω 500 Ω www 600 Ω ww 700 Ω Figure 1: Circuit symbols for a variety of useful circuit elements Problem 04.07 (17 points). Answer the following questions related to the figure below. A What is the equivalent resistance of the network of resistors in the circuit below? B If the battery has an EMF of 9V and is considered as an ideal batter (internal resistance is zero), how much current flows through it in this circuit? C If the 9V EMF battery has an internal resistance of 2 2, would this current be larger or smaller? By how much? D In the ideal battery case, calculate the current through and the voltage across each resistor in the circuit.arrow_forward
- helparrow_forwardIf the block does reach point B, how far up the curved portion of the track does it reach, and if it does not, how far short of point B does the block come to a stop? (Enter your answer in m.)arrow_forwardTruck suspensions often have "helper springs" that engage at high loads. One such arrangement is a leaf spring with a helper coil spring mounted on the axle, as shown in the figure below. When the main leaf spring is compressed by distance yo, the helper spring engages and then helps to support any additional load. Suppose the leaf spring constant is 5.05 × 10⁵ N/m, the helper spring constant is 3.50 × 10⁵ N/m, and y = 0.500 m. Truck body yo Main leaf spring -"Helper" spring Axle (a) What is the compression of the leaf spring for a load of 6.00 × 10⁵ N? Your response differs from the correct answer by more than 10%. Double check your calculations. m (b) How much work is done in compressing the springs? ☑ Your response differs significantly from the correct answer. Rework your solution from the beginning and check each step carefully. Jarrow_forward
 College PhysicsPhysicsISBN:9781305952300Author:Raymond A. Serway, Chris VuillePublisher:Cengage Learning
 University Physics Volume 1PhysicsISBN:9781938168277Author:William Moebs, Samuel J. Ling, Jeff SannyPublisher:OpenStax - Rice University
 Principles of Physics: A Calculus-Based TextPhysicsISBN:9781133104261Author:Raymond A. Serway, John W. JewettPublisher:Cengage Learning
 Physics for Scientists and Engineers: Foundations...PhysicsISBN:9781133939146Author:Katz, Debora M.Publisher:Cengage Learning
 Classical Dynamics of Particles and SystemsPhysicsISBN:9780534408961Author:Stephen T. Thornton, Jerry B. MarionPublisher:Cengage Learning
 Physics for Scientists and EngineersPhysicsISBN:9781337553278Author:Raymond A. Serway, John W. JewettPublisher:Cengage Learning