Biology (MindTap Course List)
10th Edition
ISBN: 9781285423586
Author: Eldra Solomon, Charles Martin, Diana W. Martin, Linda R. Berg
Publisher: Cengage Learning
expand_more
expand_more
format_list_bulleted
Concept explainers
Textbook Question
Chapter 1, Problem 14TYU
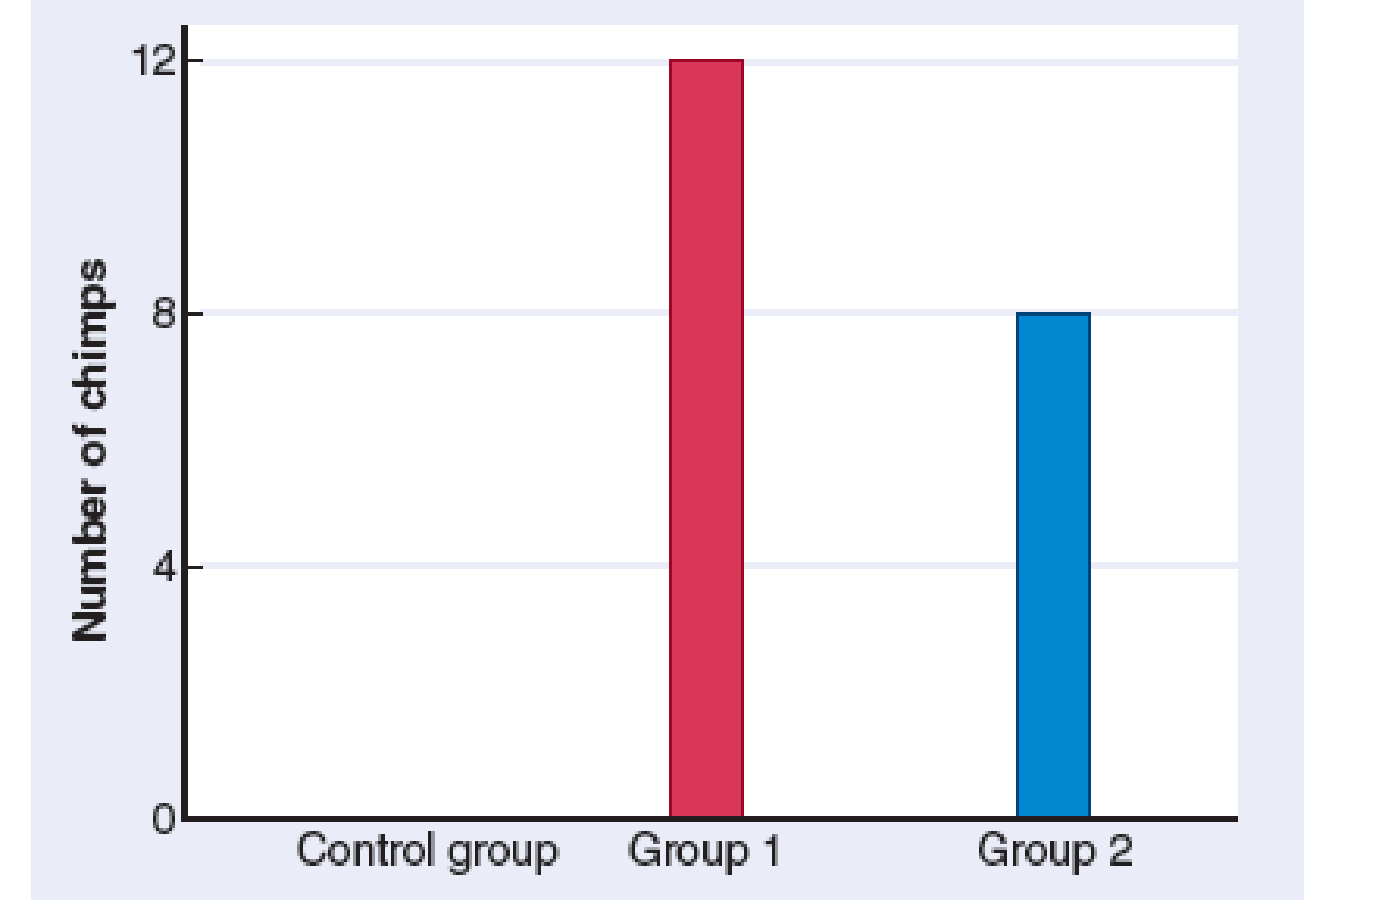
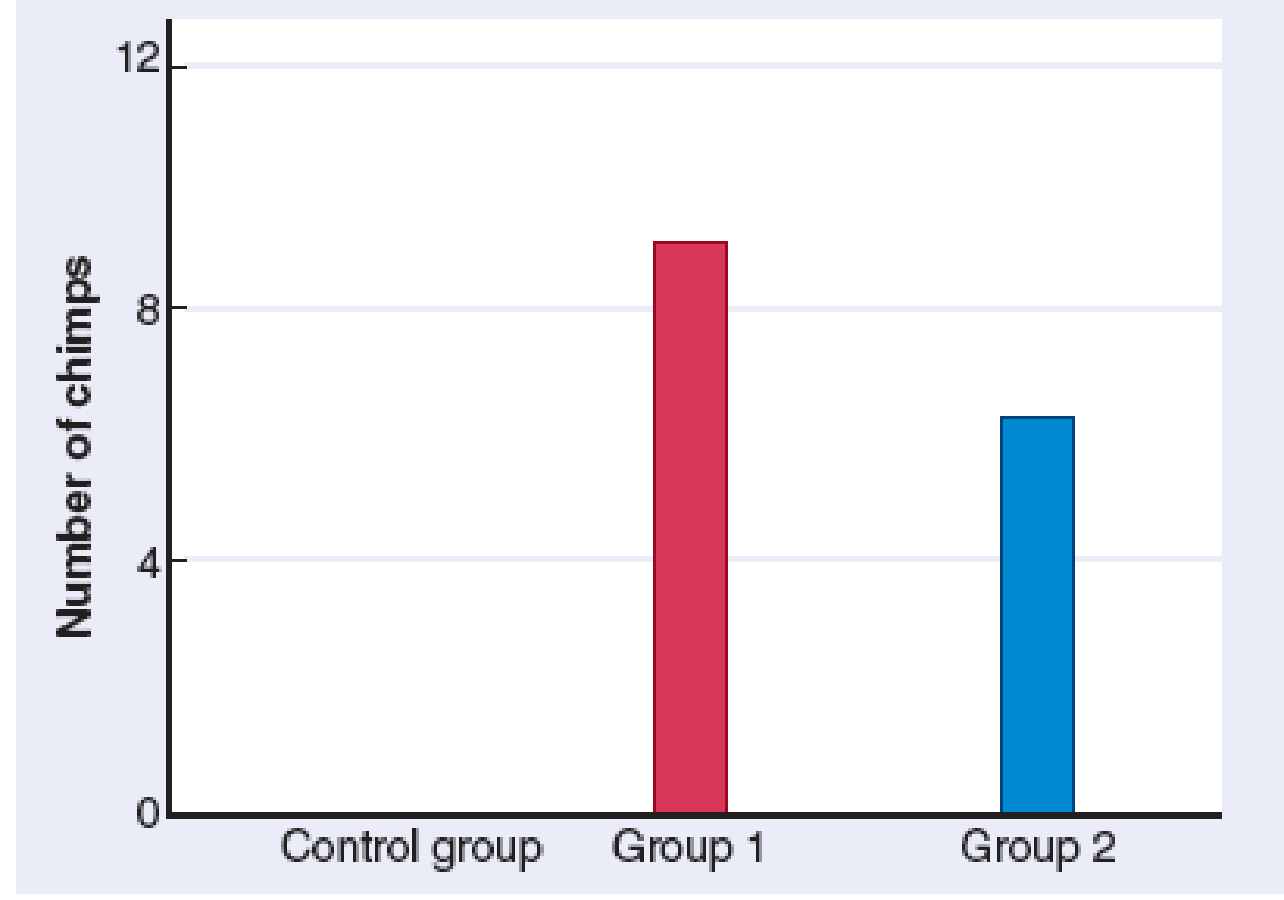
INTERPRET DATA Compare the two graphs in Figure 1-17. What information does the second graph illustrate? What possible explanation can you give for the differences shown in the two graphs?

(a) Number of chimpanzees who successfully employed specific method of tool use.

(b) Number of chimpanzees who successfully employed learned method of tool use two months later.
Figure 1-17 An experiment testing learning in chimpanzee populations In the photo, wild chimpanzees are shown observing a member of their group using a tool.
Expert Solution & Answer
Trending nowThis is a popular solution!

Students have asked these similar questions
Generate one question that requires a Punnet Squre to solve the question. Then show how you calculate the possibilities of genotype and phenotype
Briefly state the physical meaning of the electrocapillary equation (Lippman equation).
Explain in a small summary how:
What genetic information can be obtained from a Punnet square? What genetic information cannot be determined from a Punnet square?
Why might a Punnet Square be beneficial to understanding genetics/inheritance?
Chapter 1 Solutions
Biology (MindTap Course List)
Ch. 1.1 - Describe five basic themes of biology.Ch. 1.1 - Why are information transmission, energy transfer,...Ch. 1.1 - CONNECT What are some ways in which an organism is...Ch. 1.2 - Prob. 2LOCh. 1.2 - Prob. 1CCh. 1.2 - Predict What would be the consequences to an...Ch. 1.3 - Prob. 3LOCh. 1.3 - What are the levels of organization within an...Ch. 1.3 - PREDICT At which level do you think more...Ch. 1.4 - Summarize the importance of information transfer...
Ch. 1.4 - What is the function of DNA?Ch. 1.4 - How does a nervous system transmit information?Ch. 1.5 - Summarize the flow of energy through ecosystems...Ch. 1.5 - Predict What components do you think a forest...Ch. 1.5 - Connect In what ways do consumers depend on...Ch. 1.6 - Demonstrate the binomial system of nomenclature by...Ch. 1.6 - Prob. 7LOCh. 1.6 - Prob. 8LOCh. 1.6 - Prob. 9LOCh. 1.6 - The scientific name for the African rock python is...Ch. 1.6 - Prob. 2CCh. 1.6 - How might you explain the sharp claws and teeth of...Ch. 1.7 - Design a study to test a given hypothesis, using...Ch. 1.7 - Compare the reductionist and systems approaches to...Ch. 1.7 - What are the characteristics of a good hypothesis?Ch. 1.7 - Prob. 2CCh. 1.7 - CONNECT In what ways does systems biology depend...Ch. 1 - Prob. 1TYUCh. 1 - Prob. 2TYUCh. 1 - Prob. 3TYUCh. 1 - Fungi are assigned to domain (a) Protista (b)...Ch. 1 - The scientific name for corn is Zea mays. Zea is...Ch. 1 - Darwin suggested that evolution takes place by (a)...Ch. 1 - Ideally, an experimental group differs from a...Ch. 1 - Prob. 8TYUCh. 1 - VISUALIZE Draw a simple cladogram illustrating the...Ch. 1 - predict What would happen if a homeostatic...Ch. 1 - What are some characteristics of a good...Ch. 1 - PREDICT Make a prediction and devise a suitably...Ch. 1 - Prob. 13TYUCh. 1 - INTERPRET DATA Compare the two graphs in Figure...Ch. 1 - Evolution Link In what ways does evolution depend...Ch. 1 - EVOLUTION LINK How might an understanding of...Ch. 1 - SCIENCE, TECHNOLOGY, AND SOCIETY In the future,...
Knowledge Booster
Learn more about
Need a deep-dive on the concept behind this application? Look no further. Learn more about this topic, biology and related others by exploring similar questions and additional content below.Similar questions
- In a small summary write down:arrow_forwardNot part of a graded assignment, from a past midtermarrow_forwardNoggin mutation: The mouse, one of the phenotypic consequences of Noggin mutationis mispatterning of the spinal cord, in the posterior region of the mouse embryo, suchthat in the hindlimb region the more ventral fates are lost, and the dorsal Pax3 domain isexpanded. (this experiment is not in the lectures).a. Hypothesis for why: What would be your hypothesis for why the ventral fatesare lost and dorsal fates expanded? Include in your answer the words notochord,BMP, SHH and either (or both of) surface ectoderm or lateral plate mesodermarrow_forward
arrow_back_ios
SEE MORE QUESTIONS
arrow_forward_ios
Recommended textbooks for you
 Biology Today and Tomorrow without Physiology (Mi...BiologyISBN:9781305117396Author:Cecie Starr, Christine Evers, Lisa StarrPublisher:Cengage Learning
 Biology: The Dynamic Science (MindTap Course List)BiologyISBN:9781305389892Author:Peter J. Russell, Paul E. Hertz, Beverly McMillanPublisher:Cengage Learning
 Biology (MindTap Course List)BiologyISBN:9781337392938Author:Eldra Solomon, Charles Martin, Diana W. Martin, Linda R. BergPublisher:Cengage Learning
 Human Heredity: Principles and Issues (MindTap Co...BiologyISBN:9781305251052Author:Michael CummingsPublisher:Cengage Learning
 Principles Of Radiographic Imaging: An Art And A ...Health & NutritionISBN:9781337711067Author:Richard R. Carlton, Arlene M. Adler, Vesna BalacPublisher:Cengage Learning

Biology Today and Tomorrow without Physiology (Mi...
Biology
ISBN:9781305117396
Author:Cecie Starr, Christine Evers, Lisa Starr
Publisher:Cengage Learning

Biology: The Dynamic Science (MindTap Course List)
Biology
ISBN:9781305389892
Author:Peter J. Russell, Paul E. Hertz, Beverly McMillan
Publisher:Cengage Learning

Biology (MindTap Course List)
Biology
ISBN:9781337392938
Author:Eldra Solomon, Charles Martin, Diana W. Martin, Linda R. Berg
Publisher:Cengage Learning

Human Heredity: Principles and Issues (MindTap Co...
Biology
ISBN:9781305251052
Author:Michael Cummings
Publisher:Cengage Learning

Principles Of Radiographic Imaging: An Art And A ...
Health & Nutrition
ISBN:9781337711067
Author:Richard R. Carlton, Arlene M. Adler, Vesna Balac
Publisher:Cengage Learning

Genetic Variation and Mutation | 9-1 GCSE Science Biology | OCR, AQA, Edexcel; Author: SnapRevise;https://www.youtube.com/watch?v=bLP8udGGfHU;License: Standard YouTube License, CC-BY