
Videos
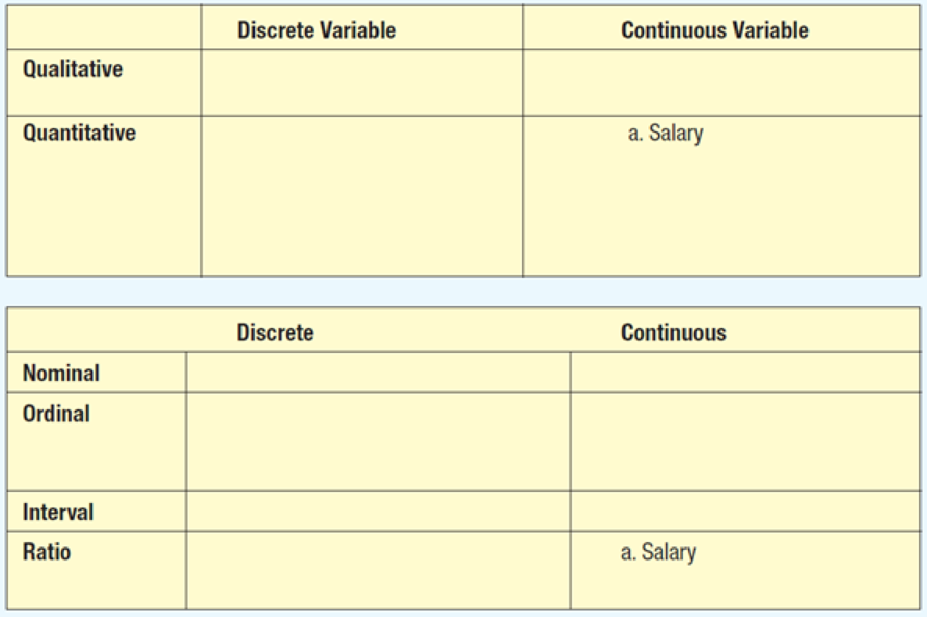
Place these variables in the following classification tables. For each table, summarize your observations and evaluate if the results are generally true. For example, salary is reported as a continuous quantitative variable. It is also a continuous ratio-scaled variable.
- a. Salary
- b. Gender
- c. Sales volume of MP3 players
- d. Soft drink preference
- e. Temperature
- f. SAT scores
- g. Student rank in class
- h. Rating of a finance professor
- i. Number of home computers
Classify each variable as discrete or continuous, qualitative or quantitative, nominal or ordinal or interval or ratio, and put them into the given tables.
Answer to Problem 13CE
The classifications of the variables in the tables are as follows:
| Discrete | Continuous | |
| Qualitative |
b. Gender d. Soft drink preference g. Student rank in class h. Rating of a finance professor | |
| Quantitative |
c. Sales volume of MP3 players f. SAT scores i. Number of home computers |
a. Salary e. Temperature |
| Discrete | Continuous | |
| Nominal | b. Gender | |
| Ordinal |
d. Soft drink preference g. Student rank in class h. Rating of a finance professor | |
| Interval | f. SAT scores | e. Temperature |
| Ratio |
c. Sales volume of MP3 players i. Number of home computers | a. Salary |
Explanation of Solution
Classification type Qualitative or quantitative:
Qualitative variable:
A qualitative variable, also called an attribute, is defined as the characteristic of an entity, which naturally takes non-numeric values. The values of a qualitative variable are usually categories. Even if such a variable happens to take numeric values, it would be simply as a label or a tag, on which, no arithmetic operations can be logically performed, other that counting the number of observations in each category and the corresponding percentages.
Quantitative variable:
A quantitative variable is defined as the characteristic of an entity, which naturally takes numeric values. It is logical to perform at least one arithmetic operation, such as addition, subtraction, multiplication, division, etc. on a quantitative variable.
Classification type: Discrete or continuous:
Discrete variable:
A discrete variable is defined as the quantitative variable corresponding to a characteristic of an entity that can take only some distinct numeric values in a given range. Within two consecutive distinct values, there is usually a gap, such that no observation can take a value in that gap. A discrete variable is usually “counted”.
Continuous variable:
A continuous variable is defined as the quantitative variable corresponding to a characteristic of an entity that can take any numeric values within a given range. It is not necessary to have a fixed gap within any two consecutive continuous variable values. A continuous variable is usually “measured”.
Classification type: Levels of measurement:
Nominal level of measurement:
A variable is said to be recorded at the nominal level of measurement, if its values comprise only of names and labels, which do not have any natural order and can only be counted.
Ordinal level of measurement:
A variable is said to be recorded at the ordinal level of measurement, if its values comprise of names and labels, which occur in a natural order and can only be counted.
Interval level of measurement:
A variable is said to be recorded at the interval level of measurement, if its values comprise of numbers or levels, in which, the distance between any two values is meaningfully defined, and the scale of measurement has a known unit.
Ratio level of measurement:
A variable is said to be recorded at the ratio level of measurement, if its values comprise of numbers, among which, the value zero is absolutely defined, and the scale of measurement has a known unit.
a. Salary:
The salary of an individual can take numerical values, on which, it is logical to perform arithmetic operation. Thus, salary is a quantitative variable.
The salary can take any numerical value within a given range. It is not necessary for the salary to be distinct numbers. Thus, salary is a continuous variable.
The salary takes numerical values, with units such as dollars. Moreover, the value 0 of salary is absolute, which implies that an individual receives no salary, and which is logical. Thus, salary is at the ratio level of measurement.
b. Gender:
The gender of an individual cannot take numerical values. On these values, it is not logical to perform arithmetic operation. Thus, gender is a qualitative variable.
The gender can be any one of several distinct categories. It cannot take any value within a given range. Thus, gender is a discrete variable.
The gender takes non-numerical values, with no units. The values of the variable gender are simply labels or tags, which are not numerical. Thus, gender is at the nominal level of measurement.
c. Sales volume of MP3 players:
The sales volume of MP3 players can take numerical values, on which, it is logical to perform arithmetic operation. Thus, sales volume of MP3 players is a quantitative variable.
The sales volume of MP3 players can take only some distinct numerical value within a given range. It can be counted, and cannot take any value within a given range. Thus, sales volume of MP3 players is a continuous variable.
The sales volume of MP3 players takes numerical values. Moreover, the value 0 of sales volume of MP3 players is absolute, which implies that there was no sale of MP3 players at a certain store, and which is logical. Thus, sales volume of MP3 players is at the ratio level of measurement.
d. Soft drink preference:
The soft drink preference of an individual cannot take numerical values. On these values, it is not logical to perform arithmetic operation. Thus, soft drink preference is a qualitative variable.
The soft drink preference can be any one of several distinct categories. It cannot take any value within a given range. Thus, soft drink preference is a discrete variable.
The soft drink preference takes non-numerical values, with no units. The values of the variable are simply labels or tags, which can have a natural order, based on the level of preference. Thus, soft drink preference is at the ordinal level of measurement.
e. Temperature:
The temperature can take numerical values, on which, it is logical to perform arithmetic operation. Thus, temperature is a quantitative variable.
The temperature can take any numerical value within a given range. It is not necessary for the temperature to be distinct numbers. Thus, temperature is a continuous variable.
The temperature takes numerical values, with units such as Celsius, Fahrenheit, Kelvin, etc. However, the value 0 of temperature is not absolute; a temperature of 0 on one scale corresponds to a non-zero temperature on another one. Thus, temperature is at the interval level of measurement.
f. SAT scores:
The SAT scores of an individual can take numerical values, on which, it is logical to perform arithmetic operation. Thus, SAT scores is a quantitative variable.
The SAT scores of students can take only some distinct values, and not just any value within a given range. It cannot take any value within a given range. Thus, SAT scores are a discrete variable.
The SAT scores take numerical. However, Moreover the value 0 of SAT scores is not absolute, and not logical. Moreover, the ratio of two SAT scores is illogical. Thus, SAT scores are at the interval level of measurement.
g. Student rank in class:
The student rank in class of an individual cannot take numerical values. On these values, it is not logical to perform arithmetic operation. Thus, student rank in class is a qualitative variable.
The student rank in class can be any one of several distinct categories. It cannot take any value within a given range. Thus, student rank in class is a discrete variable.
The student rank in class takes non-numerical values, with no units. The values of the variable are simply labels or tags, which can have a natural order, based on the class performance of the student. Thus, student rank in class is at the ordinal level of measurement.
h. Rating of a finance professor:
The rating of a finance professor cannot take numerical values. On these values, it is not logical to perform arithmetic operation. Thus, rating of a finance professor is a qualitative variable.
The rating of a finance professor can be any one of several distinct categories. It cannot take any value within a given range. Thus, rating of a finance professor is a discrete variable.
The rating of a finance professor takes non-numerical values, with no units, unless otherwise mentioned. The values of the variable are simply labels or tags, which can have a natural order, based on the level of liking for the professor. Thus, rating of a finance professor is at the ordinal level of measurement.
i. Number of home computers:
The number of home computers in a home can take numerical values, on which, it is logical to perform arithmetic operation. Thus, number of home computers is a quantitative variable.
The number of home computers can take only some distinct numerical value within a given range. It can be counted, and cannot take any value within a given range. Thus, number of home computers is a continuous variable.
The number of home computers takes numerical values. Moreover, the value 0 of number of home computers is absolute, which implies that a home has no home computers, and which is logical. Thus, number of home computers is at the ratio level of measurement.
Want to see more full solutions like this?
Chapter 1 Solutions
STATISTICAL TECHNIQUES-ACCESS ONLY


- step by step on Microssoft on how to put this in excel and the answers please Find binomial probability if: x = 8, n = 10, p = 0.7 x= 3, n=5, p = 0.3 x = 4, n=7, p = 0.6 Quality Control: A factory produces light bulbs with a 2% defect rate. If a random sample of 20 bulbs is tested, what is the probability that exactly 2 bulbs are defective? (hint: p=2% or 0.02; x =2, n=20; use the same logic for the following problems) Marketing Campaign: A marketing company sends out 1,000 promotional emails. The probability of any email being opened is 0.15. What is the probability that exactly 150 emails will be opened? (hint: total emails or n=1000, x =150) Customer Satisfaction: A survey shows that 70% of customers are satisfied with a new product. Out of 10 randomly selected customers, what is the probability that at least 8 are satisfied? (hint: One of the keyword in this question is “at least 8”, it is not “exactly 8”, the correct formula for this should be = 1- (binom.dist(7, 10, 0.7,…arrow_forwardKate, Luke, Mary and Nancy are sharing a cake. The cake had previously been divided into four slices (s1, s2, s3 and s4). What is an example of fair division of the cake S1 S2 S3 S4 Kate $4.00 $6.00 $6.00 $4.00 Luke $5.30 $5.00 $5.25 $5.45 Mary $4.25 $4.50 $3.50 $3.75 Nancy $6.00 $4.00 $4.00 $6.00arrow_forwardFaye cuts the sandwich in two fair shares to her. What is the first half s1arrow_forward
- Question 2. An American option on a stock has payoff given by F = f(St) when it is exercised at time t. We know that the function f is convex. A person claims that because of convexity, it is optimal to exercise at expiration T. Do you agree with them?arrow_forwardQuestion 4. We consider a CRR model with So == 5 and up and down factors u = 1.03 and d = 0.96. We consider the interest rate r = 4% (over one period). Is this a suitable CRR model? (Explain your answer.)arrow_forwardQuestion 3. We want to price a put option with strike price K and expiration T. Two financial advisors estimate the parameters with two different statistical methods: they obtain the same return rate μ, the same volatility σ, but the first advisor has interest r₁ and the second advisor has interest rate r2 (r1>r2). They both use a CRR model with the same number of periods to price the option. Which advisor will get the larger price? (Explain your answer.)arrow_forward
- Question 5. We consider a put option with strike price K and expiration T. This option is priced using a 1-period CRR model. We consider r > 0, and σ > 0 very large. What is the approximate price of the option? In other words, what is the limit of the price of the option as σ∞. (Briefly justify your answer.)arrow_forwardQuestion 6. You collect daily data for the stock of a company Z over the past 4 months (i.e. 80 days) and calculate the log-returns (yk)/(-1. You want to build a CRR model for the evolution of the stock. The expected value and standard deviation of the log-returns are y = 0.06 and Sy 0.1. The money market interest rate is r = 0.04. Determine the risk-neutral probability of the model.arrow_forwardSeveral markets (Japan, Switzerland) introduced negative interest rates on their money market. In this problem, we will consider an annual interest rate r < 0. We consider a stock modeled by an N-period CRR model where each period is 1 year (At = 1) and the up and down factors are u and d. (a) We consider an American put option with strike price K and expiration T. Prove that if <0, the optimal strategy is to wait until expiration T to exercise.arrow_forward
- We consider an N-period CRR model where each period is 1 year (At = 1), the up factor is u = 0.1, the down factor is d = e−0.3 and r = 0. We remind you that in the CRR model, the stock price at time tn is modeled (under P) by Sta = So exp (μtn + σ√AtZn), where (Zn) is a simple symmetric random walk. (a) Find the parameters μ and σ for the CRR model described above. (b) Find P Ste So 55/50 € > 1). StN (c) Find lim P 804-N (d) Determine q. (You can use e- 1 x.) Ste (e) Find Q So (f) Find lim Q 004-N StN Soarrow_forwardIn this problem, we consider a 3-period stock market model with evolution given in Fig. 1 below. Each period corresponds to one year. The interest rate is r = 0%. 16 22 28 12 16 12 8 4 2 time Figure 1: Stock evolution for Problem 1. (a) A colleague notices that in the model above, a movement up-down leads to the same value as a movement down-up. He concludes that the model is a CRR model. Is your colleague correct? (Explain your answer.) (b) We consider a European put with strike price K = 10 and expiration T = 3 years. Find the price of this option at time 0. Provide the replicating portfolio for the first period. (c) In addition to the call above, we also consider a European call with strike price K = 10 and expiration T = 3 years. Which one has the highest price? (It is not necessary to provide the price of the call.) (d) We now assume a yearly interest rate r = 25%. We consider a Bermudan put option with strike price K = 10. It works like a standard put, but you can exercise it…arrow_forwardIn this problem, we consider a 2-period stock market model with evolution given in Fig. 1 below. Each period corresponds to one year (At = 1). The yearly interest rate is r = 1/3 = 33%. This model is a CRR model. 25 15 9 10 6 4 time Figure 1: Stock evolution for Problem 1. (a) Find the values of up and down factors u and d, and the risk-neutral probability q. (b) We consider a European put with strike price K the price of this option at time 0. == 16 and expiration T = 2 years. Find (c) Provide the number of shares of stock that the replicating portfolio contains at each pos- sible position. (d) You find this option available on the market for $2. What do you do? (Short answer.) (e) We consider an American put with strike price K = 16 and expiration T = 2 years. Find the price of this option at time 0 and describe the optimal exercising strategy. (f) We consider an American call with strike price K ○ = 16 and expiration T = 2 years. Find the price of this option at time 0 and describe…arrow_forward
 Big Ideas Math A Bridge To Success Algebra 1: Stu...AlgebraISBN:9781680331141Author:HOUGHTON MIFFLIN HARCOURTPublisher:Houghton Mifflin Harcourt
 Glencoe Algebra 1, Student Edition, 9780079039897...AlgebraISBN:9780079039897Author:CarterPublisher:McGraw Hill
 Holt Mcdougal Larson Pre-algebra: Student Edition...AlgebraISBN:9780547587776Author:HOLT MCDOUGALPublisher:HOLT MCDOUGAL
 Functions and Change: A Modeling Approach to Coll...AlgebraISBN:9781337111348Author:Bruce Crauder, Benny Evans, Alan NoellPublisher:Cengage Learning
 College Algebra (MindTap Course List)AlgebraISBN:9781305652231Author:R. David Gustafson, Jeff HughesPublisher:Cengage Learning