
(a)
Interpretation:
The least-squares estimates of the slope and intercept for the given data set should be calculated.
Concept introduction:
The least-squares estimates of a set of data behaving linearly are defined as follows:
Answer to Problem 1.10QAP
Explanation of Solution
Given:
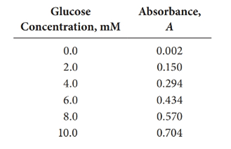
First, the data should be utilized to obtain
How to calculate
The above calculated values in the table are used to calculate
How to calculate
First, use the data in the above table to obtain
(b)
Interpretation:
Standard deviations of the slope and intercept and the standard error of the estimates for the given data set should be calculated using the LINEST function in EXCEL.
Concept introduction:
In order to use the LINEST function in EXCEL to obtain statistical values for a given data set, the following command should be typed on an EXCEL spread sheet, in which the given data is already been typed in two columns.
Answer to Problem 1.10QAP
Explanation of Solution
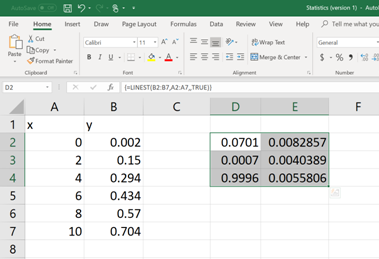
First, the data set should be entered in to an EXCEL spread sheet (See the figure below).

Then on a different cell, type the following command (See figure below). In order to enter the cell numbers of the unknown
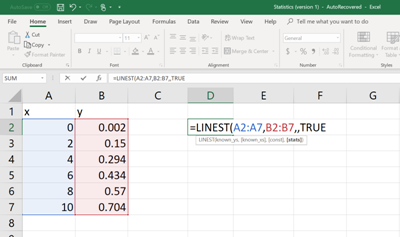
Once the formula command is written and the parenthesis is closed, then hit the ENTER button. Now, the value of
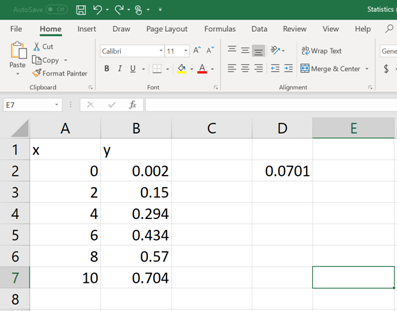
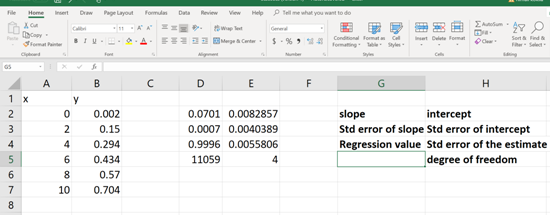
Now, select few more cells including the cell in which the command is typed and then click on the cursor bar (See below).
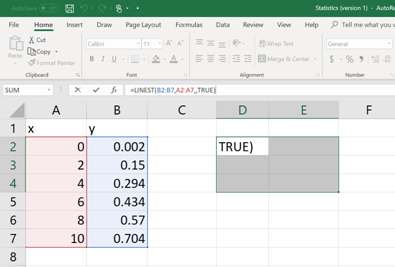
Then hit
Each of these numerical values is relevant to a statistical data (mentioned in BOLD, See below). Now pick the apocopate answers required.
(c)
Interpretation:
The
Concept introduction:
The general formula to calculate the
Answer to Problem 1.10QAP
Explanation of Solution
The t value of the above equation depends on the confidence level (95 % in this question) and the degrees of freedom of the data set.
The degrees of freedom for a regression analysis =
Once the degree of freedom is calculated the t value can be extracted from a standard table similar to the table shown below:
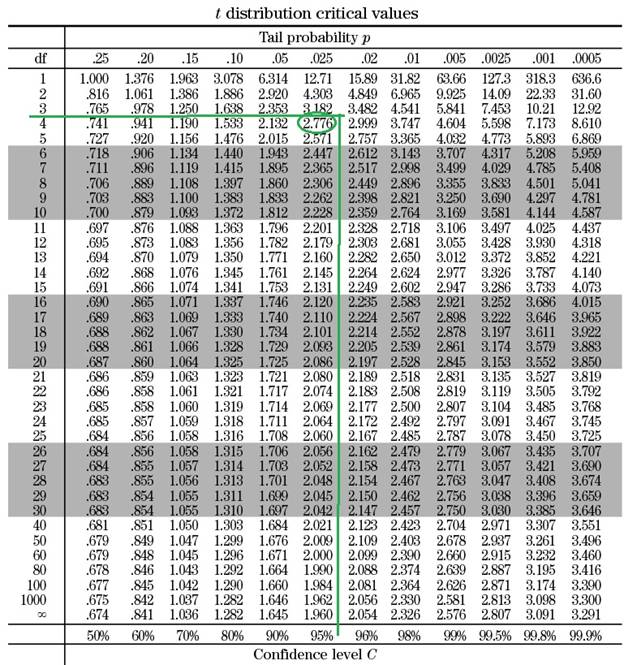
Based on the table, when the degree of freedom is 4 and the cofidence interval is 95 %, the t value is
(d)
Interpretation:
The glucose concentration and its standard deviation of a serum sample, which gave an absorbance of 0.350 should be calculated.
Concept introduction:
To determine an unknown glucose concentration
The standard deviation of
Answer to Problem 1.10QAP
Explanation of Solution
Plug in the appropriate numerical values in the below equation to determine the
How to calculate
Want to see more full solutions like this?

- Four liters of an aqueous solution containing 6.98 mg of acetic acid were prepared. At 25°C, the measured conductivity was 5.89x10⁻³ mS cm-1. Calculate the degree of dissociation of the acid and its ionization constant.Molecular weights: O (15.999), C (12.011), H (1.008).Limiting molar ionic conductivities (λ+0 and λ-0) of Ac-(aq) and H+(aq): 40.9 and 349.8 S cm-2 mol-1.arrow_forwardDetermine the change in Gibbs energy, entropy, and enthalpy at 25°C for the battery from which the data in the table were obtained.T (°C) 15 20 25 30 35Eo (mV) 227.13 224.38 221.87 219.37 216.59Data: n = 1, F = 96485 C mol–1arrow_forwardIndicate the correct options.1. The units of the transport number are Siemens per mole.2. The Siemens and the ohm are not equivalent.3. The Van't Hoff factor is dimensionless.4. Molar conductivity does not depend on the electrolyte concentration.arrow_forward
- Ideally nonpolarizable electrodes can1. participate as reducers in reactions.2. be formed only with hydrogen.3. participate as oxidizers in reactions.4. form open and closed electrochemical systems.arrow_forwardIndicate the options for an electrified interface:1. Temperature has no influence on it.2. Not all theories that describe it include a well-defined electrical double layer.3. Under favorable conditions, its differential capacitance can be determined with the help of experimental measurements.4. A component with high electronic conductivity is involved in its formation.arrow_forwardTo describe the structure of the interface, there are theories or models that can be distinguished by:1. calculation of the charge density.2. distribution of ions in the solution.3. experimentally measured potential difference.4. external Helmoltz plane.arrow_forward
- Indicate the correct options when referring to Luther's equation:1. It is not always easy to compare its results with experimental results.2. It depends on the number of electrons exchanged in the species involved.3. Its foundation is thermodynamic.4. The values calculated with it do not depend on temperature.arrow_forwardIndicate which of the unit options correspond to a measurement of current density.1. A s m-22. mC s-1 m-23. Ω m-24. V J-1 m-2arrow_forwardIndicate the options that are true when referring to electrode membranes:1. The Donnan potential, in general, does not always intervene in membranes.2. There are several ways to classify the same membrane.3. Any membrane can be used to determine the pH of a solution.4. Only one solution and one membrane are needed to determine the pH of that solution.arrow_forward
- Calculate the maximum volume of carbon dioxide gasarrow_forwardIn galvanic cells, their potential1. can be measured with a potentiometer2. does not depend on the equilibrium constant of the reaction occurring within them3. is only calculated from the normal potentials of the electrodes they comprise4. can sometimes be considered a variation in a potential differencearrow_forwardIf some molecules in an excited state collide with other molecules in a ground state, this process1. can occur in solution and in the gas phase.2. can be treated as a bimolecular process.3. always results in collisional deactivation.4. does not compete with any other process.arrow_forward

 Principles of Instrumental AnalysisChemistryISBN:9781305577213Author:Douglas A. Skoog, F. James Holler, Stanley R. CrouchPublisher:Cengage Learning