Your friend suggests that the mean number of errors for outfielders is the same regardless of the position played. You question this so you take the following random sample of 15 outfielders, who played the same number of games, and record the number of errors they made the previous season. Left Field Center Field Right Field 10 12 9 8 10 8 7 9 7 6 13 8 8 11 9
Your friend suggests that the mean number of errors for outfielders is the same regardless of the position played. You question this so you take the following random sample of 15 outfielders, who played the same number of games, and record the number of errors they made the previous season. Left Field Center Field Right Field 10 12 9 8 10 8 7 9 7 6 13 8 8 11 9
Your friend suggests that the mean number of errors for outfielders is the same regardless of the position played. You question this so you take the following random sample of 15 outfielders, who played the same number of games, and record the number of errors they made the previous season. Left Field Center Field Right Field 10 12 9 8 10 8 7 9 7 6 13 8 8 11 9
Your friend suggests that the mean number of errors for outfielders is the same regardless of the position played. You question this so you take the following random sample of 15 outfielders, who played the same number of games, and record the number of errors they made the previous season.
Left Field Center Field Right Field
10 12 9
8 10 8
7 9 7
6 13 8
8 11 9
Set up hypotheses to test your friend’s claim.
Perform a one-way analysis of variance to test this.
Definition Definition Measure of central tendency that is the average of a given data set. The mean value is evaluated as the quotient of the sum of all observations by the sample size. The mean, in contrast to a median, is affected by extreme values. Very large or very small values can distract the mean from the center of the data. Arithmetic mean: The most common type of mean is the arithmetic mean. It is evaluated using the formula: μ = 1 N ∑ i = 1 N x i Other types of means are the geometric mean, logarithmic mean, and harmonic mean. Geometric mean: The nth root of the product of n observations from a data set is defined as the geometric mean of the set: G = x 1 x 2 ... x n n Logarithmic mean: The difference of the natural logarithms of the two numbers, divided by the difference between the numbers is the logarithmic mean of the two numbers. The logarithmic mean is used particularly in heat transfer and mass transfer. ln x 2 − ln x 1 x 2 − x 1 Harmonic mean: The inverse of the arithmetic mean of the inverses of all the numbers in a data set is the harmonic mean of the data. 1 1 x 1 + 1 x 2 + ...
Expert Solution
Step 1
1.
Null Hypothesis:
H0: The mean number of errors are same for all three players.
Alternative Hypothesis:
H1: At least two players have the different mean number of errors.
Step 2
2.
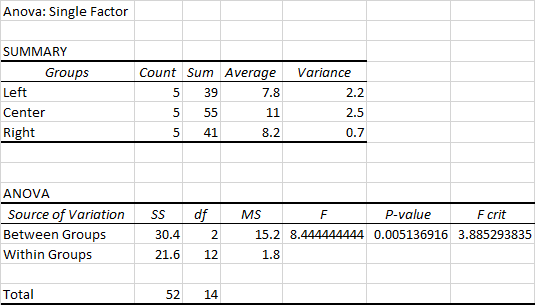
Excel Procedure:
Enter the data for Left, Center, Right in Excel sheet>Data> Data Analysis>Select ‘Anova: single factor’ and click on ‘OK’>Select the data under ‘input range’>Click on ‘OK’.
Excel Output:
From the output, the P value is 0.0051.
Step by step
Solved in 3 steps with 1 images
Knowledge Booster
Learn more about
Need a deep-dive on the concept behind this application? Look no further. Learn more about this topic, statistics and related others by exploring similar questions and additional content below.