You wish to test the following claim (Ha) at a significance level of a = 0.005. H.:µ = 68.9 Ha:µ > 68.9 You believe the population is normally distributed, but you do not know the standard deviation. You obtain a sample of size n = 358 with a mean of M = 72.3 and a standard deviation of SD = 16.7. What is the critical value for this test? (Report answer accurate to three decimal places.) critical value = What is the test statistic for this sample? (Report answer accurate to three decimal places.) test statistic = The test statistic is... O in the critical region O not in the critical region This test statistic leads to a decision to... O reject the null O accept the null O fail to reject the null


Contingency Table
A contingency table can be defined as the visual representation of the relationship between two or more categorical variables that can be evaluated and registered. It is a categorical version of the scatterplot, which is used to investigate the linear relationship between two variables. A contingency table is indeed a type of frequency distribution table that displays two variables at the same time.
Binomial Distribution
Binomial is an algebraic expression of the sum or the difference of two terms. Before knowing about binomial distribution, we must know about the binomial theorem.
Is you can't answer the full question, pls just answer the last part


(a)
Since population variance is unknown, the test statistic in this case will be
Therefore, using Excel
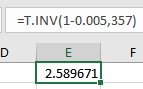
Therefore, the critical value is 2.5896

Trending now
This is a popular solution!

Step by step
Solved in 5 steps with 1 images


