You have to study the relationship between the monthly e-commerce sales and the online advertising costs. You have the survey results for 7 online stores for the last year. Your task is to find the equation of the straight line that fits the data best. The following table represents the survey results from the 7 online stores. Store Monthly E-commerce Sales (in 1000 s). X Online Advertising Dollars (1000 s). Y 1 368 1.5 2 340 1.3 3 665 2.8 4 954 0.8 5 331 1 6 556 2.2 7 376 1.3 1. Find the correlation coefficient and interpret the result. . Round the correlation coefficient to nearest thousandth if necessary. (0.13457 would be entered 0.135)
Correlation
Correlation defines a relationship between two independent variables. It tells the degree to which variables move in relation to each other. When two sets of data are related to each other, there is a correlation between them.
Linear Correlation
A correlation is used to determine the relationships between numerical and categorical variables. In other words, it is an indicator of how things are connected to one another. The correlation analysis is the study of how variables are related.
Regression Analysis
Regression analysis is a statistical method in which it estimates the relationship between a dependent variable and one or more independent variable. In simple terms dependent variable is called as outcome variable and independent variable is called as predictors. Regression analysis is one of the methods to find the trends in data. The independent variable used in Regression analysis is named Predictor variable. It offers data of an associated dependent variable regarding a particular outcome.
You have to study the relationship between the monthly e-commerce sales and the online advertising costs. You have the survey results for 7 online stores for the last year.
Your task is to find the equation of the straight line that fits the data best.
The following table represents the survey results from the 7 online stores.
| Store | Monthly E-commerce Sales (in 1000 s). X |
Online Advertising Dollars (1000 s). Y |
| 1 | 368 | 1.5 |
| 2 | 340 | 1.3 |
| 3 | 665 | 2.8 |
| 4 | 954 | 0.8 |
| 5 | 331 | 1 |
| 6 | 556 | 2.2 |
| 7 | 376 | 1.3 |
1. Find the
2. Use a TI-84 and check the graph of the
(a) Find the correlation coefficient without outlier(s). . Round the correlation coefficient to nearest thousandth if necessary. (0.13457 would be entered 0.135)
(b) Find the critical value from the table. . Does linear relation exist between monthly E-commerce sales and online advertising costs? (enter "yes", "no" or "na")
Since you have posted multiple questions, we will solve the first question for you. To get the remaining questions solved please repost the complete set of questions and mention the questions to be solved.
To find the equation of the straight line that fits the data best, it is best to calculate the regression equation.
Let,
X: E-commerce sales (Dependent variable)
Y: Online advertising dollars (Independent variable)
This is done using MS Excel.
The data is entered in the excel sheet.
The steps to calculate simple regression are-
1) Go to ‘Data’ tab and click on ‘Data Analysis’.
2) Clicking ‘Data Analysis’, provides us with a list of Analysis tools and we select ‘Regression’.
3) From the resulting dialog box, select the respective cells for X-Range and Y-Range, select labels and click on ‘OK’. The regression table is then obtained.
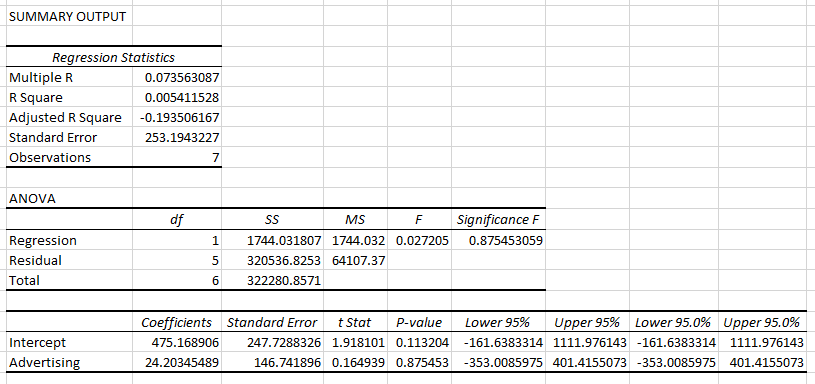
The summary table is obtained below-

The intercept obtained is 475.169 while the coefficient for advertising cost is given to be 24.203.
So, from the summary above the equation obtained is,
X=475.169+24.203Y
Trending now
This is a popular solution!
Step by step
Solved in 2 steps with 2 images


